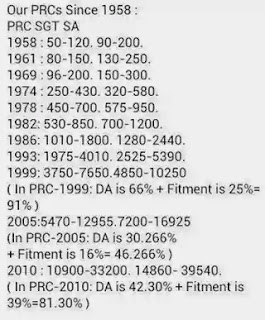
1-7-2018 నాటికి రాష్ట్ర ప్రభుత్వ ఉద్యోగుల  D.A. 30% కంటే తక్కువగా ఉంటుంది
అదే 01-07- 2013 నాడు D.A. 63.344% ఉంది, ఇపుడు అది సగానికి తగ్గనుంది 
ప్రస్తుత PRC కాలంలో  D.A పెరుగుదల క్రిందివిధంగాఉంది కేంద్రం 1%=0.524%
1-7-2013              0%   (7%కేంద్రం)
1-1-2014       5.240%   (10%)  
1-7-2014       8.908%   (7% )
1-1-2015     12.052%  (7% )
1-7-2015     15.196%  (6% )
1-1-2016     18.340%  (6% )
1-7-2016     22.008%  (7% )
1-1-2017     24.104%  (4% )
1-7-2017     25.676%  (3% )
1-1-2018     27.248%  (3% ) 
1-7-2018     29.344%  (4%) 
ఇది అంచనా మాత్రమే క్రోత్త PRC 2018 అమలు అయ్యే తేది  1-7-2018  కాబట్టి ఆరోజు ఉన్న D.A ను ఆరోజున ఉన్న PAY తో  కలిపి క్రోత్త Basic PAY ను రూపోందిస్తారు 
I.R  ఏక్కువ ఇస్తేనే, PRC Fitment ఏక్కువ  ఇవ్వడానికి అవకాశం ఉంటుందిPRC కి అనగా 1-7-2018 నాటికి రాష్ట్ర ప్రభుత్వ ఉద్యోగుల  D.A. 30% కంటే తక్కువగా ఉంటుంది
 
అదే 01-07- 2013 నాడు D.A. 63.344% ఉంది, ఇపుడు అది సగానికి తగ్గనుంది 
 
ప్రస్తుత PRC కాలంలో  D.A పెరుగుదల క్రిందివిధంగాఉంది కేంద్రం 1%=0.524%
 
1-7-2013              0%   (7%కేంద్రం)
1-1-2014       5.240%   (10%)  
1-7-2014       8.908%   (7% )
1-1-2015     12.052%  (7% )
1-7-2015     15.196%  (6% )
1-1-2016     18.340%  (6% )
1-7-2016     22.008%  (7% )
1-1-2017     24.104%  (4% )


1-7-2017     25.676%  (3% )
1-1-2018     27.248%  (3% ) 
 
1-7-2018     29.344%  (4%) ఇది అంచనా మాత్రమే తగ్గోచ్చు లేదా పెరగవచ్చు
 
క్రోత్త PRC 2018 అమలు అయ్యే తేది  1-7-2018  కాబట్టి ఆరోజు ఉన్న D.A ను ఆరోజున ఉన్న PAY తో  కలిపి క్రోత్త Basic PAY ను రూపోందిస్తారు 
 
కాబట్టి D.A. అంచనా 29.344% , 
 
I.R గతంలో మాదిరి 27% ఇవ్వకపోవచ్చు,  
 
I.R  ఏక్కువ ఇస్తేనే, PRC Fitment ఏక్కువ  ఇవ్వడానికి అవకాశం ఉంటుంది

PRC STATEMENT  PRC 2015 Appendix-1     ALL FORMS

https://tg.apteachers.in/prc/appendix.php 
 
PRC 2015 స్టేట్మెంట్ కొరకు కింద లింక్
https://tg.apteachers.in/prc/arrears2.php

GO MS 140. Dt.11.8.2017 NEW DA 22.008% READY RECKNOR


DATA FORM FOR PRC CHECK LIST.     PRC43 - FITMENT Table     PRC TableSR ENTRY FORM
Child care leave clarification   child_care_leave_application

PRC THROUGH HRMS INFORMATION IN TELUGU.    PRC DATA ENTRY FORM 

PRC  2015 FIXATION  TABLE with HRA 12%-14.5%-20%.

                      First Login into Treasury Website with DDO Code and Passward

                     Click on the PRC Tab it Display on Left Side Then below Screen Display &

      Complete Information on Red Circled Tabs  Opion entry , PP SP, Option Form, Appendix 1, Appendix 2, fixation Arrears, Then Prepare Proceedings the below screen display complete details

Treasury Website
 GRATUITY ENHANCED TO RS.10 LAKHS TO RS. 12 LAKHS 2016
 ADDL. HRA IN PRC 2015 2016FIN_MS5  
 SPL.COMPENSATORYALLOWANCE VIDE GO MS 176 DT.15-12-
 
 
AP PRC model rubber stamp (Change your mandak name)
 
             SR ENTRY FORM MASTER SCALE 13000- 110880:- 

13,000-390-14170-430-15460-470-16,870-510-18,400-550-20,050-590-21,820-640-23,740-700-25,840-760-28,120-820-30,580-880-33,220-990-36,070-1030-39,160-1110-42,490-1190-46,060-1270-49,870-1360-58,330-1560-63,010-1060-67,990-1,760-73,290-1880-78,910-2020-84,970-2160-91,450-2330-98440-2515-108500-100770-2520-110850
 
                                             Picture


 AP PRC 2015 Softwares
Andra Pradesh PRC – 2015 Pay fixation Software for Teachers

Software for Teachers

Software for Teachers

 
pdf Fitment43-Revised Pay Scales-2015- GO.46 Dt.30-4-15  
pdf Regulation of DA in PRC-2015- GO.47 Dt.30-4-15  
pdf Rates of HRA in RPS,2015 GO.48 Dt.30-4-15  
pdf Rates of CCA in RPS,2015 GO.49 Dt.30-4-15  

 PRC 2015 Volume-I  10 PRC VOLUME-1

GAD RT4050 GOM fdor 10th PRC

PRC 2015 Pension related G.Os


Grade

EXISTING SCALE ­ 2010 (Rupees)

Grade

REVISED SCALE ­ 2014 (Rupees)

Master

Scale

6700­200­7300­220­7960­240­

8680­260­9460­280­10300­300­

11200­330­12190­360­13270­390­

14440­420­15700­450­17050­490­

18520­530­20110­570­21820­610­

23650­650­25600­700­27700­750­

29950­800­32350­850­34900­900­

37600­970­40510­1040­43630­

1110­46960­1200­51760­1300­

55660 (80)


13000­390­14170­430­15460­470­

16870­510­18400­550­20050­590­

21820­640­23740­700­25840­760­

28120­820­30580­880­33220­950­

36070­1030­39160­1110­42490­

1190­46060­1270­49870­1360­

53950­1460­58330­1560­63010­

1660­67990­1760­73270­1880­

78910­2020­84970­2160­91450­

2330­100770­2520­110850 (80)

I

6700‐200‐7300‐220‐7960‐240‐8680‐

260‐9460‐280‐10300‐300‐11200‐

330‐12190‐360‐13270‐390‐14440‐

420‐15700‐450‐17050‐490‐18520‐

530‐20110(40)

I

13000‐390‐14170‐430‐15460‐470‐

16870‐510‐18400‐550‐20050‐590‐

21820‐640‐23740‐700‐25840‐760‐

28120‐820‐30580‐880‐33220‐950‐

36070‐1030‐39160‐1110‐40270 (40)

II

6900‐200‐7300‐220‐7960‐240‐8680‐

260‐9460‐280‐10300‐300‐11200‐

330‐12190‐360‐13270‐390‐14440‐

420‐15700‐450‐17050‐490‐18520‐

530‐20110‐570‐20680(40)

II

13390‐390‐14170‐430‐15460‐470‐

16870‐510‐18400‐550‐20050‐590‐

21820‐640‐23740‐700‐25840‐760‐

28120‐820‐30580‐880‐33220‐950‐

36070‐1030‐39160‐1110‐41380 (40)

III

7100‐200‐7300‐220‐7960‐240‐8680‐

260‐9460‐280‐10300‐300‐11200‐

330‐12190‐360‐13270‐390‐14440‐

420‐15700‐450‐17050‐490‐18520‐

530‐20110‐570‐21250 (40)

III

13780‐390‐14170‐430‐15460‐470‐

16870‐510‐18400‐550‐20050‐590‐

21820‐640‐23740‐700‐25840‐760‐

28120‐820‐30580‐880‐33220‐950‐

36070‐1030‐39160‐1110‐42490 (40)

IV

7520‐220‐7960‐240‐8680‐260‐9460‐

280‐10300‐300‐11200‐330‐12190‐

360‐13270‐390‐14440‐420‐15700‐

450‐17050‐490‐18520‐530‐20110‐

570‐21820‐610‐22430 (40)

IV

14600‐430‐15460‐470‐16870‐510‐

18400‐550‐20050‐590‐21820‐640‐

23740‐700‐25840‐760‐28120‐820‐

30580‐880‐33220‐950‐36070‐1030‐

39160‐1110‐42490‐1190‐44870 (40)

V

7740‐220‐7960‐240‐8680‐260‐9460‐

280‐10300‐300‐11200‐330‐12190‐

360‐13270‐390‐14440‐420‐15700‐

450‐17050‐490‐18520‐530‐20110‐

570‐21820‐610‐23040 (40)

V

15030‐430‐15460‐470‐16870‐510‐

18400‐550‐20050‐590‐21820‐640‐

23740‐700‐25840‐760‐28120‐820‐

30580‐880‐33220‐950‐36070‐1030‐

39160‐1110‐42490‐1190‐46060 (40)

VI

7960‐240(2)‐8680‐260‐9460‐280‐

10300‐300‐11200‐330‐12190‐360‐

13270‐390‐14440‐420‐15700‐450‐

17050‐490‐18520‐530‐20110‐570‐

21820‐610‐23650(40)

VI

15460‐470‐16870‐510‐18400‐550‐

20050‐590‐21820‐640‐23740‐700‐

25840‐760‐28120‐820‐30580‐880 ‐

33220‐950‐36070‐1030‐39160‐1110‐

42490‐1190‐46060‐1270‐47330 (40)

VII

8440‐240(1)‐8680‐260‐9460‐280‐

10300‐300‐11200‐330‐12190‐360‐

13270‐390‐14440‐420‐15700‐450‐

17050‐490‐18520‐530‐20110‐570‐

21820‐610‐23650‐650‐24950(40)

VII

16400‐470‐16870‐510‐18400‐550‐

20050‐590‐21820‐640‐23740‐700‐

25840‐760‐28120‐820‐30580‐880‐

33220‐950‐36070‐1030‐39160‐1110‐

42490‐1190‐46060‐1270‐49870‐(40)


Grade

EXISTING SCALE ­ 2010 (Rupees)

Grade

REVISED SCALE ­ 2014 (Rupees)

VIII

9200‐260‐9460‐280‐10300‐300‐

11200‐330‐12190‐360‐13270‐390‐

14440‐420‐15700‐450‐17050‐490‐

18520‐530‐20110‐570‐21820‐610‐

23650‐650‐25600‐700‐27000 (40)

VIII

17890‐510‐18400‐550‐20050‐590‐

21820‐640‐23740‐700‐25840‐760‐

28120‐820‐30580‐880‐33220‐950‐

36070‐1030‐39160‐1110‐42490‐

1190‐46060‐1270‐49870‐1360‐53950 (40)

IX

9460‐280‐10300‐300‐11200‐330‐

12190‐360‐13270‐390‐14440‐420‐

15700‐450‐17050‐490‐18520‐530‐

20110‐570‐21820‐610‐23650‐650‐

25600‐700‐27700(40)

IX

18400‐550‐20050‐590‐21820‐640‐

23740‐700‐25840‐760‐28120‐820‐

30580‐880‐33220‐950‐36070‐1030‐

39160‐1110‐42490‐1190‐46060‐

1270‐49870‐1360‐53950‐1460‐55410

(40)

X

10020‐280‐10300‐300‐11200‐330‐

12190‐360‐13270‐390‐14440‐420‐

15700‐450‐17050‐490‐18520‐530‐

20110‐570‐21820‐610‐23650‐650‐

25600‐700‐27700‐750‐29200 (40)

X

19500‐550‐20050‐590‐21820‐640‐

23740‐700‐25840‐760‐28120‐820‐

30580‐880‐33220‐950‐36070‐1030‐

39160‐1110‐42490‐1190‐46060‐

1270‐49870‐1360‐53950‐1460‐58330 (40)

XI

10900‐300‐11200‐330‐12190‐360‐

13270‐390‐14440‐420‐15700‐450‐

17050‐490‐18520‐530‐20110‐570‐

21820‐610‐23650‐650‐25600‐700‐

27700‐750‐29950‐800‐31550 (40)

XI

21230‐590‐21820‐640‐23740‐700‐

25840‐760‐28120‐820‐30580‐880‐

33220‐950‐36070‐1030‐39160‐1110‐

42490‐1190‐46060‐1270‐49870‐

1360‐53950‐1460‐58330‐1560‐

63010‐(40)

XII

11530‐330‐12190‐360‐13270‐390‐

14440‐420‐15700‐450‐17050‐490‐

18520‐530‐20110‐570‐21820‐610‐

23650‐650‐25600‐700‐27700‐750‐

29950 ‐800‐32350‐850‐33200 (40)

XII

22460‐640‐23740‐700‐25840‐760‐

28120‐820‐30580‐880‐33220‐950‐

36070‐1030‐39160‐1110‐42490‐

1190‐46060‐1270‐49870‐1360‐

53950‐1460‐58330‐1560‐63010‐

1660‐66330 (40)

XIII

11860‐330‐12190‐360‐13270‐390‐

14440‐420‐15700‐450‐17050‐490‐

18520‐530‐20110‐570‐21820‐610‐

23650‐650‐25600‐700‐27700‐750‐

29950‐800‐32350‐850‐34050 (40)

XIII

23100‐640‐23740‐700‐25840‐760‐

28120‐820‐30580‐880‐33220‐950‐

36070‐1030‐39160‐1110‐42490‐

1190‐46060‐1270‐49870‐1360‐

53950‐1460‐58330‐1560‐63010‐

1660‐67990 (40)

XIV

12550‐360‐13270‐390‐14440‐420‐

15700‐450‐17050‐490‐18520‐530‐

20110‐570‐21820‐610‐23650‐650‐

25600‐700‐27700‐750‐29950‐800‐

32350‐850‐34900‐900‐35800 (40)

XIV

24440‐700‐25840‐760‐28120‐820‐

30580‐880‐33220‐950‐36070‐1030‐

39160‐1110‐42490‐1190‐46060‐

1270‐49870‐1360‐53950‐1460‐

58330‐1560‐63010‐1660 ‐67990‐

1760‐71510 (40)

XV

12910‐360‐13270‐390‐14440‐420‐

15700‐450‐17050‐490‐18520‐530‐

20110‐570‐21820‐610‐23650‐650‐

25600‐700‐27700‐750‐29950‐800‐

32350‐850‐34900‐900‐36700 (40)

XV

25140‐700‐25840‐760‐28120‐820‐

30580‐880‐33220‐950‐36070‐1030‐

39160‐1110‐42490‐1190‐46060‐

1270‐49870‐1360‐53950‐1460‐

58330‐1560‐63010‐1660‐67990‐

1760‐73270 (40)

XVI

13660‐390‐14440‐420‐15700‐450‐

17050‐490‐18520‐530‐20110‐570‐

21820‐610‐23650‐650‐25600‐700‐

27700‐750‐29950‐800‐32350‐850‐

34900‐900‐37600‐970‐38570(40)

XVI

26600‐760‐28120‐820‐30580‐880‐

33220‐950‐36070‐1030‐39160‐1110‐

42490‐1190‐46060‐1270‐49870‐

1360‐53950‐1460‐58330‐1560‐

63010‐1660‐67990‐1760‐73270‐

1880‐77030 (40)


Grade

EXISTING SCALE ­ 2010 (Rupees)

Grade

REVISED SCALE ­ 2014 (Rupees)

XVII

14860‐420‐15700‐450‐17050‐490‐

18520‐530‐20110‐570‐21820‐610‐

23650‐650‐25600‐700‐27700‐750‐

29950‐800‐32350‐850‐34900‐900‐

37600‐970‐39540 (38)

XVII

28940‐820‐30580‐880‐33220‐950‐

36070‐1030‐39160‐1110‐42490‐

1190‐46060‐1270‐49870‐1360‐

53950‐1460‐58330‐1560‐63010‐

1660‐67990‐1760‐73270‐1880‐78910 (38)

XVIII

15280‐420‐15700‐450‐17050‐490‐

18520‐530‐20110‐570‐21820‐610‐

23650‐650‐25600‐700‐27700‐750‐

29950‐800‐32350‐850‐34900‐900‐

37600‐970‐40510 (38)

XVIII

29760‐820‐30580‐880‐33220‐950‐

36070‐1030‐39160‐1110‐42490‐

1190‐46060‐1270‐49870‐1360‐

53950‐1460‐58330‐1560‐63010‐

1660‐67990‐1760‐73270‐1880‐

78910‐2020‐80930 (38)

XIX

16150‐450‐17050‐490‐18520‐530‐

20110‐570‐21820‐610‐23650‐650‐

25600‐700‐27700‐750‐29950‐800‐

32350‐850‐34900‐900‐37600‐970‐

40510‐1040‐42590 (38)

XIX

31460‐880‐33220‐950‐36070‐1030‐

39160‐1110‐42490‐1190‐46060‐

1270‐49870‐1360‐53950‐1460‐

58330‐1560‐63010‐1660‐67990‐

1760‐73270‐1880‐78910‐2020‐84970 (38)

XX

18030‐490‐18520‐530‐20110‐570‐

21820‐610‐23650‐650‐25600‐700‐

27700‐750‐29950‐800‐32350‐850‐

34900‐900‐37600‐970‐40510‐1040‐

43630 (35)

XX

35120‐950‐36070‐1030‐39160‐1110‐

42490‐1190‐46060‐1270‐49870‐

1360‐53950‐1460‐58330‐1560‐

63010‐1660‐67990‐1760‐73270‐

1880‐78910‐2020‐84970–2160–

87130 (35)

XXI

19050‐530‐20110‐570‐21820‐610‐

23650‐650‐25600‐700‐27700‐750‐

29950‐800‐32350‐850‐34900‐900‐

37600‐970‐40510‐1040‐43630‐1110‐

45850 (35)

XXI

37100‐1030‐39160‐1110‐42490‐

1190‐46060‐1270‐49870‐1360‐

53950‐1460‐58330‐1560‐63010‐

1660‐67990‐1760‐73270‐1880‐

78910‐2020‐84970‐2160‐91450 (35)

XXII

20680‐570‐21820‐610‐23650‐650‐

25600‐700‐27700‐750‐29950‐800‐

32350‐850‐34900‐900‐37600‐970‐

40510‐1040‐43630‐1110‐46960(33)

XXII

40270‐1110‐42490‐1190‐46060‐

1270‐49870‐1360‐53950‐1460‐

58330‐1560‐63010‐1660‐67990‐

1760‐73270‐1880‐78910‐2020‐

84970‐2160‐91450‐2330‐93780 (33)

XXIII

21820‐610‐23650‐650‐25600‐700‐

27700‐750‐29950‐800‐32350‐850‐

34900‐900‐37600‐970‐40510‐1040‐

43630‐1110‐46960‐1200‐48160(32)

XXIII

42490‐1190‐46060‐1270‐49870‐

1360‐53950‐1460‐58330‐1560‐

63010‐1660‐67990‐1760‐73270‐

1880‐78910‐2020‐84970‐2160‐

91450‐2330‐96110 (32)

XXIV

23650‐650‐25600‐700‐27700‐750‐

29950‐800‐32350‐850‐34900‐900‐

37600‐970‐40510‐1040‐43630‐1110‐

46960‐‐1200‐49360 (30)

XXIV

46060‐1270‐49870‐1360‐53950‐

1460‐58330‐1560‐63010‐1660‐

67990‐1760‐73270‐1880‐78910‐

2020‐84970‐2160‐91450‐2330‐98440 (30)

XXV

25600‐700‐27700‐750‐29950‐800‐

32350‐850‐34900‐900‐37600‐970‐

40510‐1040‐43630‐1110‐46960‐‐

1200‐50560 (28)

XXV

49870‐1360‐53950‐1460‐58330‐

1560‐63010‐1660‐67990‐1760‐

73270‐1880‐78910‐2020‐84970‐

2160‐91450‐2330‐100770 (28)

XXVI

27000‐700‐27700‐750‐29950‐800‐

32350‐850‐34900‐900‐37600‐970‐

40510‐1040‐43630‐1110‐46960‐‐

1200‐51760(27)

XXVI

52590‐1360‐53950‐1460‐58330‐

1560‐63010‐1660‐67990‐1760‐

73270‐1880‐78910‐2020‐84970‐

2160‐91450‐2330‐100770‐2520‐

103290 (27)


Grade

EXISTING SCALE ­ 2010 (Rupees)

Grade

REVISED SCALE ­ 2014 (Rupees)

XXVII

29200‐750‐29950‐800‐32350‐850‐

34900‐900‐37600‐970‐40510‐1040‐

43630‐1110‐46960‐1200‐51760‐

1300‐53060 (25)

XXVII

56870‐1460‐58330‐1560‐63010‐

1660‐67990‐1760‐73270‐1880‐

78910‐2020‐84970‐2160–91450‐

2330‐100770‐2520‐105810 (25)

XXVIII

31550‐800‐32350‐850‐34900‐900‐

37600‐970‐40510‐1040‐43630‐1110‐

46960‐1200‐51760‐1300‐53060 (22)

XXVIII

61450‐1560‐63010‐1660‐67990‐

1760‐73270‐1880‐78910‐2020‐

84970‐2160‐91450‐2330‐ 100770‐

2520‐105810 (22)

XXIX

34050‐850‐34900‐900‐37600‐970‐

40510‐1040‐43630‐1110‐46960‐

1200‐51760‐1300‐54360(20)

XXIX

66330‐1660‐67990‐1760‐73270‐

1880‐78910‐2020‐84970‐2160‐

91450‐2330‐100770‐2520–108330 (20)

XXX

37600‐970‐40510‐1040‐43630‐1110‐

46960‐1200‐51760‐1300‐54360 (16)

XXX

73270‐1880‐78910‐2020‐84970‐

2160‐91450‐2330‐100770‐2520‐

108330 (16)

XXXI

41550‐1040‐43630‐1110‐46960‐

1200‐51760‐1300‐55660 (13)

XXXI

80930‐2020‐ 84970‐2160‐91450‐

2330‐100770‐2520‐110850 (13)

XXXII

44740‐1110‐46960‐1200‐51760‐

1300‐55660 (10)

XXXII

87130‐2160‐91450‐2330‐100770‐

2520‐110850 (10)

 
  •  
PRC-2015 Fixation and Fitment 43% W.E.F 02-06-2014
DSC 2001 SGT, RPS 2015
Final Clarifications on PRC 2015 Fixation, 12 Year Scale for DSC 2001 SGTs and LPTs
We have already given more illustrations on PRC 2015 Pay Fixation and 12 Years Scale for DSC 2001 SG Teachers/LPTs. DSC 2001 Teachers raising doubts on their fixation. Because, they have already got two(2) increments due to completion of 12 years service in the previous PRC 2010 due to not reached entry level of next promotion post. But, the Same got two increments want to in New PRC 2015 at the time of fixation.
But now 2001 DSC SG Teachers/LPTs have already reached entry level of next promotion post at the time pay fixed in RPS-2015. So, due to completion of 12 yrs service, the pay may be fixed in SPP-IA Scale by giving one(1) increment.
PRC CALCULATIONS FOR DSC 2001 SGTs/LPTs:
Case i) Increment date in January month
Basic Pay(As on 01.07.2013) : 13660
DA(63.344%) : 8653
Fitment(43%) : 5874
Total Emoluments :28187
This 28187 amount is between 28120 and 28940, so
Pay fixed at Next stage : 22460- 66330/ Rs.28940/-
Pay after next A.G.I as on 01.01.2014 : 22460- 66330/ Rs.29760/-
Due to completion of 12 yrs service on 17-01-2014,
SPP-IA(12Years) Scale Allowed on 18-01-2014
*Existing Scale and Pay as on 18.01.2014 : 22460- 66330/Rs.29760/-
*Scale and Pay as on 18-01-2014 in SPP-IA Scale : 28940- 78910/Rs.30580/-
Pay after next A.G.I on 01.01.2015 : 28940- 78910/ Rs.31460/-
Date of Next Annual Grade Increment : 01.01.2016
Case ii) If the Teacher preponed their increment date to October month
Pay fixed in RPS-2015 as on 01.07.2013 : 22460- 66330/ Rs.28940/-
Pay after next A.G.I as on 01.10.2013 : 22460- 66330/ Rs.29760/-
*SPP-IA(12Years)Scale Allowed on 18-01-2014
*Existing Scale and Pay as on 18.01.2014 : 22460- 66330/Rs.29760/-
*Scale & Pay as on 18-01-2014 in SPP-IA Scale : 28940- 78910/Rs.30580/-
Pay after next A.G.I on 01.10.2014 : 28940- 78910/ Rs.31460/-
Date of Next Annual Grade Increment : 01.10.2015
Case iii) If the Teacher preponed their inc
MASTER SCALE 13000- 110880:- 

13,000-390-14170-430-15460-470-16,870-510-18,400-550-20,050-590-21,820-640-23,740-700-25,840-760-28,120-820-30,580-880-33,220-990-36,070-1030-39,160-1110-42,490-1190-46,060-1270-49,870-1360-58,330-1560-63,010-1060-67,990-1,760-73,290-1880-78,910-2020-84,970-2160-91,450-2330-98440-2515-108500-100770-2520-110850
PRC 2015 Model Fixation:-

PRC 2015 MODEL FIXATION
Basic Pay as on 01-07-2013
        13270
DA @63.344 as on 01-07-2013
         8406
Fitmet @43%
         5706
Total
       27382
New Basic Pay Fixed In the Next Stage of PRC 2015
       28120
                    Scale of Pays:-
PRC 2015 NEW SCALES
Cadre
Ordinary Scales
6 Years
12 Years
24 Years
SGT/LP/PET
21230-63010
22460-66330
28940-78910
35120-87130
School Asst
28940-78910
29760-80930
35120-87130
40270-93780
Head Master/MEO
35120-87130
37100-91450
420270-93780
46060-98440
                     PRC 2015 DA:-
PRC 2015 DA %
02-06-2014
5.24%
01-07-2014
3.668%
Till Today Total DA
8.908%
 
 
PRC ARREAR AMOUNT DSC WISE AMOUNT
DSC 2008 LPS/PETS
42099
DSC 2006 SGT
45063
DSC 2012 SAs
51835
DSC 2002 SGT
57931
DSC 2008 SAs
56487
DSC 2006 LP/PETs
45693
DSC 2012 SGT/LPs/PETs
38453
DSC 2003 SGT
45567
DSC 2001 SGT
59782
DSC 2008 SGT
40824
 
PRC 2015 PAY FIXATION SOFTWARE AP ( Trial ) PRC 2015 PAY FIXATION SOFTWARE TS & AP ( Trial )

Simple calculation of APPRC-2015
1)NEW BASIC=PRESENT BASIC x 2.116
2)NEW GROSS=PRESENT GROSS x 1.185
3)GPF CREDIT= 9 x PRESENT GROSS x 0.181

14.5% of HRA PLACES - 2015 PRC:

Srikakulam Dist: 1.Srikakulam, 2.Palasa, Kasibugga.

Vizianagaram Dist: 3.Parvathipuram, 4.Bobbili.

East Godavari Dist:5. Tuni,6.Samalkot, 7.Pithapuram,8.Mandapet,9.Amalapuram.

***

West Godavari Dist:10.Tadepalligudem, 11.Tanuku, 12.Bhimavaram, 13.Narasapur, 14.Palakole.

Krishna Dist:15.Jaggaiahpet,16. Nuzvid, 17.Gudivada, 18.Machilipatnam.

Guntur Dist:19. Macherla, 20.Piduguralla,21.Tadepalle,22.Mangalagiri, 23.Sattenapalle,24.Vinukonda,25.Narasaraopet, 26.Chilakaluripet,27.Tenali,28.Ponnur,29.Bapatla,30.Repalle.

Prakasam Dist:31.Markapur,32.Chirala, 33.Kandukur.

Nellore Dist.:34.Kavali,35.Gudur, 36.Venkatagiri.

Kadapa Dist.:37.Badvel, 38.Jammalamadugu, 39.Pulivendla,40.Rayachoti, 41.Rajampet.

Kurnool Dist.:42.Yemmiganur,43.Adoni,44.Dhone.

Anantapur Dist.:45.Rayadurg, 46.Guntakal, 47.Tadipatri, 48.Dharmavaram, 49.Kadiri,50.Hindupur

Chittoor:51.Srikalahasti,52.Madanapalli,53.Nagari,54.Puttur,55.Punganur,56.Chittoor and 57. Palamaner.

JAC discussions with Group of Ministers on PRC - JAC Demands on PRC

On 13th Jan 2015, JAC Joint Action Committee of Employees, Teachers, Workers and Pensioners, Andhra Pradesh  has wrote a letter to the Convener of Group of Ministers on PRC
Ref:- Govt. Lr. No. 247/01/A1/HRM.V/2015-3, Fin. (HRM.V) Dept., dated 08.01.2015.

  • The Hon'ble Minister for Finance has convened a meeting with the Employees Associations on Implementation of the 10th PRC at 2.00 P.M. on 13.01.2015 in the Chambers of Minister for Finance & Planning, A.P. Secretariat.
  • In this connection, JAC has discussed the matter in detail in the JAC Executive Committee Meeting held on 12.01.2015 at APNGO's Home, Hyderabad and decided to discuss with the Group of Ministers on the following issues. 

JAC Demands on PRC 2014

  1. 1) Minimum Pay has to be raised from Rs.13,000/- to Rs.15,000/- and maximum pay from Rs. 1,10,850/- to 1,37,600/-.
  2. 2) The JAC expressed dissatisfaction on the recommendation of 29% Fitment by the PRC. The JAC is of the opinion that 69% is appropriate to the present inflation rates.
  3. 3) The PRC has to be implemented w.e.f. 01.07.2013 with all monetary benefits.
  4. 4) The services of Contract employees and Full Time Contingent Workers has to be regularised.
  5. 5) The HRA payable with in peripheral distance of 8 Kms. has to be enhanced to 15 Kms.
  6. 6) The maximum Increment rate of 2.33% has to be raised to 2.832%.
  7. 7) Gratuity has to be enhanced up to Rs.15.00 Lakhs instead of Rs.12.00 Lakhs.
  8. 8) Restoration of Commuted portion of Pension paid after 12 years instead of present 15 years.
  9. 9) District Headquarters, viz., Machilipatnam, Sr'ikakulam & Chittoor have to be allowed HRA@ 20% irrespective of Population.
  10. 10) The Bad Climate Allowance for the employees working in Agencies has to be restored.
  11. 11) The Pay Scales of Common Categories, i.e., Junior Asst., Senior Asst., Superintendent has to be raised on par with Secretariat Staff since the qualifications and work nature are one and the same. 
  12. 12)180 days Maternity leave to the Contract and Outsourcing employees has to be  provided with Pay and Allowances. 
  13. 13) All employees who are drawing salary from Government has to be provided salaries under 010 Head of Account duly bringing under roof by changing system of  Grant-in-Aid etc. 
  14. 14) The Pay Revision has to be implemented to all State Govt. Employees including  Public Sector Undertakings and Gurukula Vidyalayas, Co-operative Societies etc. 
  15. 15) The superannuation age to State Govt. employees has to be extended to all State Govt. Organisations like Public Sector, Grandhalaya Samsthas, Gurukulas. Societies etc.which were not already enhanced. 
  16. 16) School Fees reimbursement has to be paid on par with Govt. of India rates.


RPS-2010 DA's >5.136%-1.1.09 >9.416-1.7.09 >16.264%-1.1.10 >24.824%-1.7.10

>29.96%-1.1.11 >35.952%-1.7.11 >41.944%-1.1.12 >47.936%-1.7.12
>54.784%-1.1.13 >63.344%-1.7.13 >71.904%-1.1.14>77.896%-1.7.14


Grade

EXISTING SCALE ­ 2010 (Rupees)

Grade

REVISED SCALE ­ 2014 (Rupees)

Master

Scale

6700­200­7300­220­7960­240­

8680­260­9460­280­10300­300­

11200­330­12190­360­13270­390­

14440­420­15700­450­17050­490­

18520­530­20110­570­21820­610­

23650­650­25600­700­27700­750­

29950­800­32350­850­34900­900­

37600­970­40510­1040­43630­

1110­46960­1200­51760­1300­

55660 (80)


13000­390­14170­430­15460­470­

16870­510­18400­550­20050­590­

21820­640­23740­700­25840­760­

28120­820­30580­880­33220­950­

36070­1030­39160­1110­42490­

1190­46060­1270­49870­1360­

53950­1460­58330­1560­63010­

1660­67990­1760­73270­1880­

78910­2020­84970­2160­91450­

2330­100770­2520­110850 (80)

I

6700‐200‐7300‐220‐7960‐240‐8680‐

260‐9460‐280‐10300‐300‐11200‐

330‐12190‐360‐13270‐390‐14440‐

420‐15700‐450‐17050‐490‐18520‐

530‐20110(40)

I

13000‐390‐14170‐430‐15460‐470‐

16870‐510‐18400‐550‐20050‐590‐

21820‐640‐23740‐700‐25840‐760‐

28120‐820‐30580‐880‐33220‐950‐

36070‐1030‐39160‐1110‐40270 (40)

II

6900‐200‐7300‐220‐7960‐240‐8680‐

260‐9460‐280‐10300‐300‐11200‐

330‐12190‐360‐13270‐390‐14440‐

420‐15700‐450‐17050‐490‐18520‐

530‐20110‐570‐20680(40)

II

13390‐390‐14170‐430‐15460‐470‐

16870‐510‐18400‐550‐20050‐590‐

21820‐640‐23740‐700‐25840‐760‐

28120‐820‐30580‐880‐33220‐950‐

36070‐1030‐39160‐1110‐41380 (40)

III

7100‐200‐7300‐220‐7960‐240‐8680‐

260‐9460‐280‐10300‐300‐11200‐

330‐12190‐360‐13270‐390‐14440‐

420‐15700‐450‐17050‐490‐18520‐

530‐20110‐570‐21250 (40)

III

13780‐390‐14170‐430‐15460‐470‐

16870‐510‐18400‐550‐20050‐590‐

21820‐640‐23740‐700‐25840‐760‐

28120‐820‐30580‐880‐33220‐950‐

36070‐1030‐39160‐1110‐42490 (40)

IV

7520‐220‐7960‐240‐8680‐260‐9460‐

280‐10300‐300‐11200‐330‐12190‐

360‐13270‐390‐14440‐420‐15700‐

450‐17050‐490‐18520‐530‐20110‐

570‐21820‐610‐22430 (40)

IV

14600‐430‐15460‐470‐16870‐510‐

18400‐550‐20050‐590‐21820‐640‐

23740‐700‐25840‐760‐28120‐820‐

30580‐880‐33220‐950‐36070‐1030‐

39160‐1110‐42490‐1190‐44870 (40)

V

7740‐220‐7960‐240‐8680‐260‐9460‐

280‐10300‐300‐11200‐330‐12190‐

360‐13270‐390‐14440‐420‐15700‐

450‐17050‐490‐18520‐530‐20110‐

570‐21820‐610‐23040 (40)

V

15030‐430‐15460‐470‐16870‐510‐

18400‐550‐20050‐590‐21820‐640‐

23740‐700‐25840‐760‐28120‐820‐

30580‐880‐33220‐950‐36070‐1030‐

39160‐1110‐42490‐1190‐46060 (40)

VI

7960‐240(2)‐8680‐260‐9460‐280‐

10300‐300‐11200‐330‐12190‐360‐

13270‐390‐14440‐420‐15700‐450‐

17050‐490‐18520‐530‐20110‐570‐

21820‐610‐23650(40)

VI

15460‐470‐16870‐510‐18400‐550‐

20050‐590‐21820‐640‐23740‐700‐

25840‐760‐28120‐820‐30580‐880 ‐

33220‐950‐36070‐1030‐39160‐1110‐

42490‐1190‐46060‐1270‐47330 (40)

VII

8440‐240(1)‐8680‐260‐9460‐280‐

10300‐300‐11200‐330‐12190‐360‐

13270‐390‐14440‐420‐15700‐450‐

17050‐490‐18520‐530‐20110‐570‐

21820‐610‐23650‐650‐24950(40)

VII

16400‐470‐16870‐510‐18400‐550‐

20050‐590‐21820‐640‐23740‐700‐

25840‐760‐28120‐820‐30580‐880‐

33220‐950‐36070‐1030‐39160‐1110‐

42490‐1190‐46060‐1270‐49870‐(40)


Grade

EXISTING SCALE ­ 2010 (Rupees)

Grade

REVISED SCALE ­ 2014 (Rupees)

VIII

9200‐260‐9460‐280‐10300‐300‐

11200‐330‐12190‐360‐13270‐390‐

14440‐420‐15700‐450‐17050‐490‐

18520‐530‐20110‐570‐21820‐610‐

23650‐650‐25600‐700‐27000 (40)

VIII

17890‐510‐18400‐550‐20050‐590‐

21820‐640‐23740‐700‐25840‐760‐

28120‐820‐30580‐880‐33220‐950‐

36070‐1030‐39160‐1110‐42490‐

1190‐46060‐1270‐49870‐1360‐53950 (40)

IX

9460‐280‐10300‐300‐11200‐330‐

12190‐360‐13270‐390‐14440‐420‐

15700‐450‐17050‐490‐18520‐530‐

20110‐570‐21820‐610‐23650‐650‐

25600‐700‐27700(40)

IX

18400‐550‐20050‐590‐21820‐640‐

23740‐700‐25840‐760‐28120‐820‐

30580‐880‐33220‐950‐36070‐1030‐

39160‐1110‐42490‐1190‐46060‐

1270‐49870‐1360‐53950‐1460‐55410

(40)

X

10020‐280‐10300‐300‐11200‐330‐

12190‐360‐13270‐390‐14440‐420‐

15700‐450‐17050‐490‐18520‐530‐

20110‐570‐21820‐610‐23650‐650‐

25600‐700‐27700‐750‐29200 (40)

X

19500‐550‐20050‐590‐21820‐640‐

23740‐700‐25840‐760‐28120‐820‐

30580‐880‐33220‐950‐36070‐1030‐

39160‐1110‐42490‐1190‐46060‐

1270‐49870‐1360‐53950‐1460‐58330 (40)

XI

10900‐300‐11200‐330‐12190‐360‐

13270‐390‐14440‐420‐15700‐450‐

17050‐490‐18520‐530‐20110‐570‐

21820‐610‐23650‐650‐25600‐700‐

27700‐750‐29950‐800‐31550 (40)

XI

21230‐590‐21820‐640‐23740‐700‐

25840‐760‐28120‐820‐30580‐880‐

33220‐950‐36070‐1030‐39160‐1110‐

42490‐1190‐46060‐1270‐49870‐

1360‐53950‐1460‐58330‐1560‐

63010‐(40)

XII

11530‐330‐12190‐360‐13270‐390‐

14440‐420‐15700‐450‐17050‐490‐

18520‐530‐20110‐570‐21820‐610‐

23650‐650‐25600‐700‐27700‐750‐

29950 ‐800‐32350‐850‐33200 (40)

XII

22460‐640‐23740‐700‐25840‐760‐

28120‐820‐30580‐880‐33220‐950‐

36070‐1030‐39160‐1110‐42490‐

1190‐46060‐1270‐49870‐1360‐

53950‐1460‐58330‐1560‐63010‐

1660‐66330 (40)

XIII

11860‐330‐12190‐360‐13270‐390‐

14440‐420‐15700‐450‐17050‐490‐

18520‐530‐20110‐570‐21820‐610‐

23650‐650‐25600‐700‐27700‐750‐

29950‐800‐32350‐850‐34050 (40)

XIII

23100‐640‐23740‐700‐25840‐760‐

28120‐820‐30580‐880‐33220‐950‐

36070‐1030‐39160‐1110‐42490‐

1190‐46060‐1270‐49870‐1360‐

53950‐1460‐58330‐1560‐63010‐

1660‐67990 (40)

XIV

12550‐360‐13270‐390‐14440‐420‐

15700‐450‐17050‐490‐18520‐530‐

20110‐570‐21820‐610‐23650‐650‐

25600‐700‐27700‐750‐29950‐800‐

32350‐850‐34900‐900‐35800 (40)

XIV

24440‐700‐25840‐760‐28120‐820‐

30580‐880‐33220‐950‐36070‐1030‐

39160‐1110‐42490‐1190‐46060‐

1270‐49870‐1360‐53950‐1460‐

58330‐1560‐63010‐1660 ‐67990‐

1760‐71510 (40)

XV

12910‐360‐13270‐390‐14440‐420‐

15700‐450‐17050‐490‐18520‐530‐

20110‐570‐21820‐610‐23650‐650‐

25600‐700‐27700‐750‐29950‐800‐

32350‐850‐34900‐900‐36700 (40)

XV

25140‐700‐25840‐760‐28120‐820‐

30580‐880‐33220‐950‐36070‐1030‐

39160‐1110‐42490‐1190‐46060‐

1270‐49870‐1360‐53950‐1460‐

58330‐1560‐63010‐1660‐67990‐

1760‐73270 (40)

XVI

13660‐390‐14440‐420‐15700‐450‐

17050‐490‐18520‐530‐20110‐570‐

21820‐610‐23650‐650‐25600‐700‐

27700‐750‐29950‐800‐32350‐850‐

34900‐900‐37600‐970‐38570(40)

XVI

26600‐760‐28120‐820‐30580‐880‐

33220‐950‐36070‐1030‐39160‐1110‐

42490‐1190‐46060‐1270‐49870‐

1360‐53950‐1460‐58330‐1560‐

63010‐1660‐67990‐1760‐73270‐

1880‐77030 (40)


Grade

EXISTING SCALE ­ 2010 (Rupees)

Grade

REVISED SCALE ­ 2014 (Rupees)

XVII

14860‐420‐15700‐450‐17050‐490‐

18520‐530‐20110‐570‐21820‐610‐

23650‐650‐25600‐700‐27700‐750‐

29950‐800‐32350‐850‐34900‐900‐

37600‐970‐39540 (38)

XVII

28940‐820‐30580‐880‐33220‐950‐

36070‐1030‐39160‐1110‐42490‐

1190‐46060‐1270‐49870‐1360‐

53950‐1460‐58330‐1560‐63010‐

1660‐67990‐1760‐73270‐1880‐78910 (38)

XVIII

15280‐420‐15700‐450‐17050‐490‐

18520‐530‐20110‐570‐21820‐610‐

23650‐650‐25600‐700‐27700‐750‐

29950‐800‐32350‐850‐34900‐900‐

37600‐970‐40510 (38)

XVIII

29760‐820‐30580‐880‐33220‐950‐

36070‐1030‐39160‐1110‐42490‐

1190‐46060‐1270‐49870‐1360‐

53950‐1460‐58330‐1560‐63010‐

1660‐67990‐1760‐73270‐1880‐

78910‐2020‐80930 (38)

XIX

16150‐450‐17050‐490‐18520‐530‐

20110‐570‐21820‐610‐23650‐650‐

25600‐700‐27700‐750‐29950‐800‐

32350‐850‐34900‐900‐37600‐970‐

40510‐1040‐42590 (38)

XIX

31460‐880‐33220‐950‐36070‐1030‐

39160‐1110‐42490‐1190‐46060‐

1270‐49870‐1360‐53950‐1460‐

58330‐1560‐63010‐1660‐67990‐

1760‐73270‐1880‐78910‐2020‐84970 (38)

XX

18030‐490‐18520‐530‐20110‐570‐

21820‐610‐23650‐650‐25600‐700‐

27700‐750‐29950‐800‐32350‐850‐

34900‐900‐37600‐970‐40510‐1040‐

43630 (35)

XX

35120‐950‐36070‐1030‐39160‐1110‐

42490‐1190‐46060‐1270‐49870‐

1360‐53950‐1460‐58330‐1560‐

63010‐1660‐67990‐1760‐73270‐

1880‐78910‐2020‐84970–2160–

87130 (35)

XXI

19050‐530‐20110‐570‐21820‐610‐

23650‐650‐25600‐700‐27700‐750‐

29950‐800‐32350‐850‐34900‐900‐

37600‐970‐40510‐1040‐43630‐1110‐

45850 (35)

XXI

37100‐1030‐39160‐1110‐42490‐

1190‐46060‐1270‐49870‐1360‐

53950‐1460‐58330‐1560‐63010‐

1660‐67990‐1760‐73270‐1880‐

78910‐2020‐84970‐2160‐91450 (35)

XXII

20680‐570‐21820‐610‐23650‐650‐

25600‐700‐27700‐750‐29950‐800‐

32350‐850‐34900‐900‐37600‐970‐

40510‐1040‐43630‐1110‐46960(33)

XXII

40270‐1110‐42490‐1190‐46060‐

1270‐49870‐1360‐53950‐1460‐

58330‐1560‐63010‐1660‐67990‐

1760‐73270‐1880‐78910‐2020‐

84970‐2160‐91450‐2330‐93780 (33)

XXIII

21820‐610‐23650‐650‐25600‐700‐

27700‐750‐29950‐800‐32350‐850‐

34900‐900‐37600‐970‐40510‐1040‐

43630‐1110‐46960‐1200‐48160(32)

XXIII

42490‐1190‐46060‐1270‐49870‐

1360‐53950‐1460‐58330‐1560‐

63010‐1660‐67990‐1760‐73270‐

1880‐78910‐2020‐84970‐2160‐

91450‐2330‐96110 (32)

XXIV

23650‐650‐25600‐700‐27700‐750‐

29950‐800‐32350‐850‐34900‐900‐

37600‐970‐40510‐1040‐43630‐1110‐

46960‐‐1200‐49360 (30)

XXIV

46060‐1270‐49870‐1360‐53950‐

1460‐58330‐1560‐63010‐1660‐

67990‐1760‐73270‐1880‐78910‐

2020‐84970‐2160‐91450‐2330‐98440 (30)

XXV

25600‐700‐27700‐750‐29950‐800‐

32350‐850‐34900‐900‐37600‐970‐

40510‐1040‐43630‐1110‐46960‐‐

1200‐50560 (28)

XXV

49870‐1360‐53950‐1460‐58330‐

1560‐63010‐1660‐67990‐1760‐

73270‐1880‐78910‐2020‐84970‐

2160‐91450‐2330‐100770 (28)

XXVI

27000‐700‐27700‐750‐29950‐800‐

32350‐850‐34900‐900‐37600‐970‐

40510‐1040‐43630‐1110‐46960‐‐

1200‐51760(27)

XXVI

52590‐1360‐53950‐1460‐58330‐

1560‐63010‐1660‐67990‐1760‐

73270‐1880‐78910‐2020‐84970‐

2160‐91450‐2330‐100770‐2520‐

103290 (27)


Grade

EXISTING SCALE ­ 2010 (Rupees)

Grade

REVISED SCALE ­ 2014 (Rupees)

XXVII

29200‐750‐29950‐800‐32350‐850‐

34900‐900‐37600‐970‐40510‐1040‐

43630‐1110‐46960‐1200‐51760‐

1300‐53060 (25)

XXVII

56870‐1460‐58330‐1560‐63010‐

1660‐67990‐1760‐73270‐1880‐

78910‐2020‐84970‐2160–91450‐

2330‐100770‐2520‐105810 (25)

XXVIII

31550‐800‐32350‐850‐34900‐900‐

37600‐970‐40510‐1040‐43630‐1110‐

46960‐1200‐51760‐1300‐53060 (22)

XXVIII

61450‐1560‐63010‐1660‐67990‐

1760‐73270‐1880‐78910‐2020‐

84970‐2160‐91450‐2330‐ 100770‐

2520‐105810 (22)

XXIX

34050‐850‐34900‐900‐37600‐970‐

40510‐1040‐43630‐1110‐46960‐

1200‐51760‐1300‐54360(20)

XXIX

66330‐1660‐67990‐1760‐73270‐

1880‐78910‐2020‐84970‐2160‐

91450‐2330‐100770‐2520–108330 (20)

XXX

37600‐970‐40510‐1040‐43630‐1110‐

46960‐1200‐51760‐1300‐54360 (16)

XXX

73270‐1880‐78910‐2020‐84970‐

2160‐91450‐2330‐100770‐2520‐

108330 (16)

XXXI

41550‐1040‐43630‐1110‐46960‐

1200‐51760‐1300‐55660 (13)

XXXI

80930‐2020‐ 84970‐2160‐91450‐

2330‐100770‐2520‐110850 (13)

XXXII

44740‐1110‐46960‐1200‐51760‐

1300‐55660 (10)

XXXII

87130‐2160‐91450‐2330‐100770‐

2520‐110850 (10)


REPORT OF 10th PAY REVISION COMMISSION Andhra Pradesh 2014

Volume – I

P.K. AGARWAL, I.A.S., (Retd.)

Pay Revision Commissioner


CHAPTER I

 INTRODUCTION


01.01              In  response  to  the  representations  received  from  several Associations  representing  Government  employees  for a review  in pay scales, the Government of Andhra Pradesh constituted the Tenth Pay Revision Commission Vide G.O.Ms.No.95, G.A. (Spl.A)Department,dated: 28.2.2013. The Government also appointed Sri Pradip Kumar Agarwal, IAS (Retd) as Pay Revision Commissioner and notified the following terms of reference for the Commission:

(i)          To evolve the principles which may govern the structure of emoluments and the conditions of service of various categories of employees of the State Government, Local Bodies and Aided Institutions, Non‐teaching staff of the Universities  including  Acharya  N.G.  Ranga  Agricultural  University, Jawaharlal Nehru Technological University, Work charged employees and full‐time contingent employees, which have a financial bearing taking into account the total packet of benefits available to them and suggest changes therein  which  may  be  desirable  and  feasible;  The  Commission  however shall,  not  deal  with  the teaching  staff  in Government  Colleges  and Government  Aided  Private  Colleges  drawing  UGC/AICTE  and  ICAR  scales. The  Commission  shall  also  not  deal  with  the  officers  of A.P.  State  Higher Judicial Service and A.P. State Judicial Service who are drawing Pay Scales as recommended by the First National Judicial Pay Commission.

(ii)         To examine as to what extent the existing DA may be merged in pay and, to evolve consequent new set of pay scales merging DA therein and to suggest the mode of fixation of pay in the Revised Pay Scales.

(iii)      To study the Automatic Advancement Scheme as modified from time to time keeping in view the anomalies that have arisen during the implementation  of the said scheme and also to examine whether the said scheme should continue in its present form and to make the recommendations in this regard.

(iv)        To  examine  the  need  for  various  Special  Pays,  Compensatory  and various other Allowances and other perquisites in cash or kind now allowed and to make recommendations  regarding  their continuance or otherwise and if continuance is recommended what modifications, if any  are  deemed,  desirable  with  regard  to  their  rates,  terms  and other conditions which should govern them in future.

(v)       To examine and review the existing pension structure for pensioners, and make recommendations which may be desirable and feasible.

(vi)        To   examine   the   recommendations   of   the   OMC   constituted   vide

G.O.Ms.No.142, G.A. (Spl.A) Department, dated: 07.03.2012.

 (vii)             Review  of the existing  human  resources  of all departments  in tune with the contemporary requirements including contract/ outsourcing personnel.

(viii)    To give its recommendations on any other matter referred to it by the State Government during the tenure of its office.

(ix)        In formulating  its recommendations,  the Commission  shall take into account the overall financial position of the State.


01.02. The Pay Revision Commission commenced its work on 13.3.2013 and issued a Press note requesting the Service Associations/ Individuals/ Pensioners’  Associations  and  employees  local  bodies,  including  Zilla Grandhalaya  Samsthas,  Aided  Institutions,  Universities  including  Jawaharlal Nehru Technological and Acharya N.G. Ranga Agriculture University of the State Government employees, to put forth grievances before the Commission by 30th April,  2013.  Later,  on  the  request  of  several  associations,   the  period  for submission of grievances was extended to 31st  May, 2013 and again to 29‐06‐2013.   The Commission  also sent a Questionnaire  covering various aspects of the ‘Terms of Reference’ to various associations, Unions, Secretaries to Government and all Heads of the Departments.  The Commission requested all the respondents to send replies to the questionnaire by 31st May 2013. The Pay Revision Commission followed a flexible approach with regard to receipt of representations and allowed considerable time and freedom to the individuals and  associations  to  present  their  memorandum  and  make  presentations  in person.  The Commission also addressed all the Heads of the Departments to furnish information in Proforma   I, II, III and IV with a brief right up on the Department. The Heads of the Departments were also requested to appoint a liaison officer to deal with the Commission and to furnish a copy of the latest service rules, special pays and special allowances, by 30th April, 2013.   The working of the Commission was greatly strengthened after the Government appointed  Sri  M.Purushotham  Reddy,  I.A.S(Rtd)  as  Secretary  to  the  PRC  on19.9.2013.


01.03.               The Commission  in all received 849written  representations  and it organized     761 meetings with the Service Associations, Unions and even individuals who had given representations in writing. These meetings were commenced on 5.7.2013 and continued till the middle of December, 2013. The contents of written representations  were analyzed and clarifications sought in respect of about 800 categories of services. These meetings were found to be extremely useful and a number of issues got clarified. Many of these meetings were attended by the concerned Special Chief Secretaries/ Secretaries and the Heads of Departments and by the Office Bearers of Employees’ Unions/Associations  who  all  made  very  valuable  contribution  to  the Proceedings of the Commission.


CHAPTER­II  Pay Revision Commissions  An Overview 


02.01                Since the formation of Andhra Pradesh Government have, so far, set  up  ten  Pay  Commissions  while  in  Government  of  India  constitution  of Seventh Pay Commission has recently been announced.  While the Government of India has constituted  the Commission  once in 10 years the practice in the State  since  1974  has  been  to  have  a Commission  once  in  5‐6  years.  A brief history  of  the  Pay  Commissions  constituted  by  the  State  Government  is  as follows:      After  the  formation  of  Andhra  Pradesh  the  1st   Pay  Revision  was initiated  in  1958  under  the  Chairmanship  of  Sri  K.Brahmananda  Reddy,  the then Finance  Minister.   The 2nd  Pay Revision  Commission  was constituted  in

1965 as a One Man Commission under Justice N.D.Krishna Rao. The 3rd Pay Revision Commission was headed by Sri R.Prasad, I.C.S., (Retd)., the 4th Pay Revision  Commission  by  Sri  A.  Krishna  Swamy,  I.A.S.,  (Retd)..,  the  5th   Pay Revision Commission by Sri K.Subrahmanyam, IAS.,  the 6th Pay Revision  by Sri D.Shankaraguruswamy, IAS.,. (Retd)., the 7th Pay Revision Commission  by Sri R.K.R.  Gonela,  IAS,  (Retd.),  the  8th   Pay  Commission  by  Sri  J.Rambabu,  IAS., (Retd) and the 9th  Pay Commission by Sri C. S. Rao, IAS (Retd.).   The following table  indicates  the  dates  of constitution,  time  taken  by  the  Commission  and other details relating to various Commissions appointed since 1958.

Statement showing the particulars of Pay Revision from time to time

Sl. No

PRC

Date/Year of

Constitution

Date of

Submission of report

Time taken

Date of

Implementation

Financial

Implications

1

1958

NA

NA

NA

NA

NA

2

1965

NA

NA

NA

NA

NA

3

1974

06‐06‐1974

29‐06‐1975

Nearly 11 months

1‐1‐1974 with monetary

benefit from

1‐1‐1975.

Rs.7.50 cr.

4

1978 Pay

Scale + Pensions

01‐01‐1978

17‐09‐1979

Nearly 1 year

8 months

1‐4‐1978 with monetary

benefit from

1‐3‐1979

Rs.31.15 cr.

5

1986

10‐05‐1985

13‐07‐1986

Nearly 1 year

2 months

1‐7‐1986

Rs.75 cr.

6

1993

03‐05‐1991

08‐04‐1993

Nearly 1 year

11 months (Universities Non‐teaching staff included)

1‐7‐1992 with monetary

benefit from

1‐4‐1993

Rs.210.50 cr.

7

1999

Pay Scales + Pensions

01‐02‐1998

21‐07‐1999 (Govt. Emp.)

25‐08‐1999 (Universities)

Nearly 1 year

5 months (Govt . and University

Employees)

1‐7‐1998 with Monetary benefit from

1‐4‐1999

Rs.1257.82 cr.

8

2005

Scales    + Pensions

23‐02‐2004

30‐06‐2005

Nearly one year 4

months

1‐7‐2003 with

Monetary benefit     w.e.f.

1‐4‐2005

Rs.1199.62 cr.


Sl.

No

PRC

Date/Year of

Constitution

Date of

Submission of report

Time taken

Date of

Implementation

Financial

Implications

9

2008

07‐07‐2008

November,

2009

Nearly one year 4 months

1‐7‐2008 with monetary benefit     from

1.2.2010

Rs.1629.78 cr.


02.02                The constitution of a Pay Commission, at regular intervals, is necessitated to examine the pay structure of employees and to revise it based upon the changing requirements. The expectation of the employee community is that  their  pay  should  be  increased  by  the  Government  from  time  to time keeping in view the increase in the cost of living, increased expectations with regard  to  life  style  and  in  the  case  of  the  retired  government  servants  the increase in life span with consequent problems arising out of age related problems.


02.03                In  order  to  meet  the  situation  arising  due  to  high  levels  of inflation, a mechanism  had also to be found by the Government  to neutralize the effect of inflation on the wages of its employees to cover the interregnum between the Pay Commissions. Sanction of Dearness Allowance at periodic intervals according to a pre‐determined formula was the Government response to counter the effect of increase in prices on the wages of the employees. While neutralization for increases in cost of living was extended in full to certain categories  of employees  others were compensated  only partially till the year

1996.  The 5th Central Pay Commission pointed out that in the absence of 100%

neutralization   for  increase  in  cost  of  living  to  all  sections  of  government servants there will be an erosion in the wages of the people who are not fully compensated for such increases resulting in distortion in the pay structure violently disturbing the ratio of maximum to minimum which was established in  the  first  year  of  implementation   of  a  Pay  Commission’s   award.   They therefore, recommended 100% neutralization for the increase in cost of living for  all  sections  of  government  servants  and  pensioners.     There,  however, remained the issue of erosion in the real value of other allowances which are related to salary and the employees, therefore demanded an increase in other allowances also commensurate with the increase in cost of living. Since the Government of India was appointing a Commission once in 10 years they addressed this issue by providing for increases in other allowances  when the DA, as a percentage of the pay, exceeded 50%. In our State, however, since the pay  revisions   are  taking   place  almost   every   5‐6  years  the  necessity   for considering a part of D.A., as pay for purposes of allowances has not arisen so far.


02.04                A    characteristic    feature    of    pay    revisions    has    been    the appointment of an Anomalies Committee immediately after the implementation of the report  of the Pay Commission.    The Anomalies  Committees  appointed prior to 9th PRC rectified many anomalies in the Pay structure suggested  bythe respective PRCs. However, the Anomalies Committees appointed under the chairmanship of Sri R.M. Gonela, I.A.S. (Retd.) after the 9th  PRC could not make any recommendation  on rectification  within the period of its working. On the


demand of employees the Government instead of extending the tenure of the Anomalies Committee, announced the constitution of 10th PRC.  It was for the first time that the Tenth PRC was announced by the Government before the due date of revision of pay, i.e. 5 years from the date of earlier PRC. This decision of the   Government   was   widely   welcomed   by   the   employees.   However,   the grievances of employees with respect to the recommendations  of 9th  PRC remained  unaddressed  and their subsequent  representations  have been subsumed into this report.


02.05              This Commission has looked at various aspects affecting the emoluments   of   the   employees   and   worked   out   an   appropriate   package consisting of a streamlined Master Scale, a span of scales that avoids stagnation, ensured    that the quantum of increment is consistent with the increases in the quantum of pay and that there is a reasonable increase in other allowances etc. The Commission has also adequately recognized the special needs of women employees  and  employees  who  are  physically  challenged  in  recommending special leave and enhanced allowances.   This time there was no request from the employees’ side either to adopt central pay scales or to look at the private sector for working  out the compensation  package.  All the Associations  relied upon the ILC norms to work out the ‘minimum pay’. Variations in the minimum pay demanded by various associations are on account of i) taking the number of members in a family unit as 4 instead of 3; ii) difference in the market price of food and clothing; and iii) addition of new items of expenditure such as mobile phone, transport, fuel, gas, electricity etc., not covered by ILC norms.


02.06. This  Commission  has  relied    upon    the  ILC  norms  to  work  out  the

‘Minimum Pay’, retained the family size of 3 and adopted the market price of food and other commodities as reported by the Directorate of Economic and Statistics. The Commission also while calculating the ‘Minimum Pay’ adequately provided for the new items of expenditure as demanded by most employees associations and thus made the pay structure more realistic and attractive.


CHAPTER III STATE ECONOMY­AN OVERVIEW


Introduction


03.01                The terms of reference mandate the Pay Revision Commission to make recommendations on the revision of pay and allowances of employees of State Government, local bodies, aided institutions and non‐teaching staff of universities taking into account the overall financial position of the State Government.   There  are  a  number   of  competing   demands   on  the  limited resources of the State Government. The demands on the resources of the State have increased considerably in recent years because of the focus on inclusive growth and the welfare of the weaker sections of the society. The associations of   employees   have   represented   to   the   Commission   seeking   considerable increase in the existing pay scales and allowances on account of among others a considerable increase in the cost of living over the last few years. Given the committed liabilities and competing demands on the resources of the State Government, these demands cannot be met fully. The Commission is of the considered   view  that  while  the  pay  scales  of  the  employees   have  to  be reasonable to attract talented people into government service and retain them, the responsibility of the State to provide its citizens basic civic amenities and its role in promoting the growth of the economy cannot be viewed in isolation. Therefore, the present financial position of the State Government, its future commitments and growth prospects of the economy are crucial for arriving at a pay structure for employees consistent with the objectives of State policy.


03.02                Andhra Pradesh has been a middle income State. While there has been  considerable  improvement  in the levels  of per capita  income,  the State ranks below a number of states in terms of human development indicators. In this chapter, an attempt has been made to present an outline of the State’s performance in recent years and demands on its resources to arrive at an informed view of the reasonable  pay structure for employees  consistent with the resource position of the State Government.

Growth Performance


03.03. Until  the  nineties,  the  average  growth  of  the  Gross  State  Domestic Product (GSDP) of the State remained below the growth of the Gross Domestic Product (GDP) of the country.   In a sharp contrast to the past trends, the State economy registered a growth of 8.16 percent in 2000‐01 compared with the national growth of 4.15 percent. This was facilitated by an impressive growth of

13.16  percent  in  the  agriculture  sector  following  a  negative  growth  in  the previous   year.  Since  2003‐04,   there  has  been  a  turnaround   in  the  State economy and the growth of the economy has consistently been higher than the national  average  with  the  exception  of  2009‐10.  Lower  than  the  national growth in 2009‐10 was on account of a steep fall in the growth of agriculture and industry sectors. Growth of the industry and service sectors largely contributed to the growth of the State economy since 2003‐04. The growth of


the State economy  which entered  a higher growth  trajectory  in 2003‐04  has been witnessing a slow down in its growth since 2008‐09 following global downturn and deceleration in the growth of the national economy.

03.04.               Though the growth of the State economy slipped from a peak of

12.02 percent in 2007‐08 to 5.29 percent in 2012‐13, it remained marginally higher than the national economy. Reviving the growth momentum is a major challenge for the State Government. Table‐1 presents the trends in the growth rates of GSDP and the GDP.

Table­1: Aggregate and Sectoral Growth Rates­Andhra Pradesh and India

Period / Year

Sectoral growth %

AP ­

Growth

of GSDP (%)

India ­

Growth

of GDP (%)

Agriculture

Industry

Services

AP

India

AP

India

AP

India

1960‐71

1.07

6.74

5.15

11.25

3.59

5.66

2.11

7.08

1970‐81

1.18

7.09

5.97

0.74

5.02

4.95

3.02

5.01

1980‐91

3.79

12.89

7.20

5.24

8.26

4.62

5.21

7.17

1990‐01

2.95

4.02

6.56

7.33

6.43

5.19

5.42

5.29

1999‐00

‐2.28

2.67

3.50

5.96

8.88

12.05

4.58

8.00

2000‐01

13.16

‐0.01

‐2.30

6.03

7.73

5.07

8.16

4.15

2001‐02

‐1.53

6.01

6.35

2.61

7.69

6.61

4.22

5.39

2002‐03

‐7.76

‐6.60

12.14

7.21

6.30

6.74

2.73

3.99

2003‐04

15.14

9.05

6.29

7.32

7.92

7.89

9.35

7.97

2004‐05

4.44

0.18

3.95

9.81

8.27

8.28

8.15

7.05

2005‐06

6.12

5.14

10.05

9.72

11.04

10.91

9.57

9.48

2006‐07

1.97

4.16

17.60

12.17

12.48

10.06

11.18

9.57

2007‐08

17.38

5.80

10.87

9.67

10.30

10.27

12.02

9.32

2008‐09

0.76

0.09

7.15

4.44

9.50

9.98

6.88

6.72

2009‐10

0.21

0.81

3.04

9.16

7.10

10.50

4.53

8.59

2010‐11

7.29

7.94

7.51

9.16

11.60

9.75

9.66

9.32

2011‐12

0.78

3.65

7.71

3.49

10.53

8.20

7.82

6.21

2012‐13

7.13

1.91

‐2.00

2.08

7.43

7.11

5.29

4.99


03.05.               The  per capita  income  of the State,  which  remained  below  the national  average  till 1999‐2000,  witnessed  a turnaround  since  2000‐01.  The per capita income of the State remained higher than the national average in all the years since 2000‐01 partly due to higher than national average growth of the  State  economy   and  largely  due  to  the  moderation   in  the  growth   of population. The decennial growth of population in the State was   14.6   percent between   1991   and   2001   and   9.11   percent   between   2001   and   2011   as compared with the national average of      21.54 per cent and 17.67 percent, respectively.    In the year  2012‐13  for which  latest  data  is available,  the per capita income of the State at current prices was Rs.78,177  as compared  with the national average of Rs.68,757. Trends in per capita income of the State and the country are presented in Table‐2.


Table­2: Trends in Per Capita Income­Andhra Pradesh and All­India


Period/

years

Average annual Per capita income at current

prices (Rs)

Average annual growth of per capita

income (%)

Ratio of per capita income of

AP to all­

India (%)

AP

India

AP

India

1960‐71

4422

4965

0.26

1.23

89.1

1970‐81

4904

5575

0.94

1.12

88.0

1980‐91

6160

6788

3.04

3.24

90.7

1990‐01

8865

9587

4.01

3.98

92.5

1999‐00

15507

15881

4.26

4.56

97.6

2000‐01

16622

16173

7.19

1.84

102.8

2001‐02

18573

17782

11.74

9.95

104.4

2002‐03

19434

18885

4.64

6.20

102.9

2003‐04

21931

20871

12.85

10.52

105.1

2004‐05

25321

24143

15.46

15.68

104.9

2005‐06

28539

27131

12.71

12.38

105.2

2006‐07

33135

31206

16.10

15.02

106.2

2007‐08

39727

35825

19.89

14.80

110.9

2008‐09

46345

40775

16.66

13.82

113.7

2009‐10

51114

46249

10.29

13.42

110.5

2010‐11

60703

54151

18.76

17.09

112.1

2011‐12

68970

61564

13.62

13.69

112.0

2012‐13

78177

68757

13.35

11.68

113.7


03.06.               The  deceleration   in  the  growth  of  the  State  economy   being witnessed in recent years is a matter of concern. Given the global uncertainties and domestic supply constraints, it is difficult to estimate the extent of likely slowdown in the State economy and the duration of the slowdown.

Section­2: Fiscal Situation of the State

03.07.               The   finances   of  the  State   started   deteriorating   towards   the middle of the nineties and this continued till 2002‐03. Apart from the low buoyancies of State taxes and falling transfers from the Centre as a proportion of GDP, the introduction of full prohibition in the State in 1995‐96, subsidized rice scheme and the losses of the State Electricity Board largely contributed to the poor health of State finances. The revenue and fiscal deficits of the State deteriorated to 1.87 percent and 4.67 percent of GSDP, respectively in 2002‐03 compared with 0.47 percent and 2.90 percent in 1990‐91, respectively.  There has  been  a  major  improvement  in  State  finances  since  about  2003‐04.  The major contributory factor for such an improvement is the turnaround in the growth of the State economy as well as the national economy. The enactment of Fiscal  Responsibility  and  Budget  Management  Act  in  2005  mandating elimination of revenue deficit and containing fiscal deficit at 3 percent of GDP and the introduction of VAT have also greatly contributed to an improvement in


the   fiscal   situation.   The   trends   in   the   fiscal   situation   of   the   State   are summarized in Table‐3.

Table­3: Fiscal situation in Andhra Pradesh ­ 2007­08 to 2014­15 (Rs. Crores)


Actual

Actual

Actual

Actual

Actual

Actual

R.E.

B.E.

Change:

2014­15 over

2007­08


07­08


08­09


09­10


10­11


11­12


12­13


13­14


14­15

I. Total revenue (a+d)

54143

62858

64678

80996

93554

103830

127772

149149

95007

a) Own revenue

35858

43042

42979

55859

64978

75874

87837

101043

65185

b) Own tax revenue

28794

33358

35176

45140

53283

59875

72443

84781

55987

c) Own non‐tax revenue

7064

9683

7803

10720

11694

15999

15394

16262

9198

d)Transfers from the Centre

18284

19817

21699

25137

28576

27956

39936

48106

29822

II. Revenue expenditure

53984

61854

63448

78534

90415

102702

126749

148675

94692

III. Revenue deficit

‐159

‐1004

‐1230

‐2462

‐3138

‐1128

‐1023

‐474

‐315

IV. Fiscal deficit

8787

12406

14010

11803

15402

17508

24487

25402

16615

As Percentage of GSDP at Current Prices


I. Total revenue (a+d)

14.84

14.73

13.56

14.19

14.28

13.92

14.96

15.25

0.41

a) Own revenue

9.83

10.09

9.01

9.78

9.92

10.17

10.29

10.33

0.51

b) Own tax revenue

7.89

7.82

7.38

7.91

8.13

8.03

8.48

8.67

0.78

c) Own non‐tax revenue

1.94

2.27

1.64

1.88

1.78

2.15

1.80

1.66

‐0.27

d) Transfers from the Centre

5.01

4.64

4.55

4.40

4.36

3.75

4.68

4.92

‐0.09

II. Revenue expenditure

14.80

14.49

13.31

13.75

13.80

13.77

14.84

15.21

0.41

III. Revenue deficit

‐0.04

‐0.24

‐0.26

‐0.43

‐0.48

‐0.15

‐0.12

‐0.05

0.00

IV. Fiscal deficit

2.41

2.91

2.94

2.07

2.35

2.35

2.87

2.60

0.19


03.08. The improvement in State finances which started in 2003‐04 continued till  2007‐08.  While  the  fiscal  deficit  declined  from  3.90  percent  of  GSDP  in

2003‐04  to 2.41 percent  of GSDP in 2007‐08,  the revenue  account  improved


from a deficit of 1.55 percent of GSDP to a surplus of 0.04 percent of GSDP in the same period. This improvement in the fiscal situation was the result of marginal augmentation in revenue and compression of revenue expenditure. During this period, there was a marginal improvement  in total revenue  from

14.08 percent of GSDP to 14.84 percent of GSDP while the revenue expenditure witnessed  a  decline  from  15.63  percent  of  GSDP  to  14.80  percent  of  GSDP. Within the revenue, the major improvement came from the State’s own tax revenue which improved from 7.23 percent of GSDP in 2003‐04  to 7.89 percent of GSDP in 2007‐08. The buoyancy of State VAT coupled with an improvement in the revenue from State excise duties and stamps and registration contributed to this improvement. There was also a marginal improvement in the transfers from the Centre from 4.95 percent of GSDP to 5.01 percent of GSDP in the same period.


03.09.               Since  2008‐09,  there  has  been  a  moderation  in  the  growth  of revenue. The deterioration in the fiscal situation could be controlled because of a marginal moderation in revenue expenditure as proportion of GSDP. Because of  considerable  increase  in  revenue  expenditure,  there  is  an  increase  in  the fiscal deficit from 2.35 percent of GSDP in 2012‐13 to 2.87 percent of GSDP in

2013‐14. The actual realization  of revenue receipts in 2013‐14 is likely to be

lower than the budget estimate by about Rs.18,000 crore because of fall in own revenue collections  as well as transfers from the Centre. The deterioration  in the  fiscal  position  of  the  State  would  have  been  much  severe  but  for  the reduction in interest and repayment  liability following the debt consolidation and relief facility recommended by the Twelfth Finance Commission for the period2005‐10.

Expenditure on Salaries, Wages and Pensions

03.10.               Expenditure  on  salaries  and  pensions  witnessed  a  moderation from 76.13 percent of own revenues of the States in 2000‐01 to 57.54 percent in 2013‐14. As a percentage of revenue expenditure, the decline is modest from

43.88 percent to 39.87 percent in the same period. Even with the moderation,

over 57 percent of the State’s own revenue is spent on    salaries and pensions. The moderation in the expenditure on salaries and pension as a proportion of State’s own revenue and total revenue expenditure is mainly because of higher growth of State revenue and revenue expenditure relative to the growth in the expenditure on salaries and pensions. In fact, expenditure on salaries is one of the  fastest growing item of expenditure. Between 2001‐02 and 2013‐14, while the salary expenditure increased by 21.45 percent from Rs.7,791 crores to Rs.36,331 crores, expenditure on pensions increased by 16.33 percent from Rs.2,321 crores to Rs.14,209 crores.


03.11.               There  are  two  distinct  phases  in  the  ratios  of  expenditure  on salaries  and  pensions  to  own  revenue  and  revenue  expenditure.  The moderation in the ratios which started around 2001‐02 continued till 2008‐09. Between  2001‐02  and  2008‐09,  the  ratios  of  expenditure  on  salaries  and pension   to   own   revenue   and   expenditure   declined   by   over   20   and   15 percentage points, respectively. But there has been a reversal of this declining


trend  since  2009‐10.  In  2009‐10,  the  ratio  of  expenditure  on  salaries  and pensions to own revenue increased from 45.99 in the previous year to 55.25. The expenditure  on salaries  and pensions  as a percentage  of revenue expenditure increased from 31.49 in 2008‐09 to 36.71 in 2009‐10. The increase in the ratios is mainly on account of a slowdown in the revenues of the State Government. The increase in the ratio of expenditure on salaries and pensions to own revenue to 57.54 percent in 2013‐14 from 54.93 percent in the previous year is mainly on account of the interim relief of 27 percent paid to the government employees.

Table­4:  Expenditure on Salaries and Pensions as Proportion of State’s

Revenue and Expenditure(Rs. in Crores)

Year

Expenditure on salaries, wages

and pensions as %of

Expenditure on establishment

as% of

Own revenue

Total

Revenue

Revenue expenditure

Own revenue

Total

Revenue

Revenue expenditure

1990‐91

74.80

47.90

46.53

4.44

2.84

2.76

1991‐92

72.56

46.62

45.39

5.11

3.29

3.20

1992‐93

72.38

45.76

44.98

4.58

2.89

2.84

1993‐94

70.46

44.27

45.56

4.35

2.73

2.81

1994‐95

76.71

50.27

46.42

4.83

3.17

2.92

1995‐96

82.28

47.70

44.38

3.79

2.20

2.04

1996‐97

80.91

47.03

36.58

4.51

2.62

2.04

1997‐98

66.82

42.97

40.90

3.22

2.07

1.97

1998‐99

69.49

47.80

40.22

3.24

2.23

1.88

1999‐00

73.28

49.93

46.52

2.65

1.81

1.68

2000‐01

76.13

51.97

43.88

3.42

2.34

1.97

2001‐02

66.65

46.53

41.11

3.71

2.63

2.32

2002‐03

66.41

46.62

41.15

3.31

2.33

2.05

2003‐04

65.47

42.42

38.21

3.37

2.18

1.97

2004‐05

60.44

42.07

38.63

3.29

2.29

2.10

2005‐06

58.82

39.96

39.10

2.59

1.76

1.72

2006‐07

53.61

36.85

39.35

2.40

1.65

1.76

2007‐08

51.13

33.86

33.96

2.28

1.51

1.51

2008‐09

45.99

31.49

32.01

4.93

3.38

3.43

2009‐10

55.25

36.71

37.43

5.58

3.71

3.78

2010‐11

59.17

40.80

42.08

3.84

2.65

2.73

2011‐12

57.72

40.09

41.48

6.69

4.65

4.81

2012‐13

54.93

40.14

40.58

6.60

4.82

4.88

2013‐14 (RE)

57.54

39.55

39.87

5.95

4.09

4.13

2014‐15 (V/Ac BE)

52.30

35.43

35.55

5.18

3.51

3.52


Salary Expenditure of Central Government Employees


03.12.               In the context of analysis of the trends in the expenditure of the State government on salaries and pensions, it may be relevant to compare these trends with those of the Central Government. The comparison is not straight forward because of a number of differences. Firstly, the salary expenditure  of the Centre as reported in the budget documents is exclusive of the salaries of defense personnel. Secondly, expenditure on pensions reported in the budget documents  of  the  Centre  is  inclusive  of  defense  pensions  but  exclusive  of Railways and Department of Posts which are treated as operating expenses of these  departments.  Even  with  these  differences,  a  broad  comparison  of  the trends in the expenditure on salaries and pensions reveal vast differences between the State and the Centre. The broad trends in the expenditure of the Centre on salaries and pensions are presented in Table‐5.

Table­5: Expenditure of the Central Government on Salaries and Pensions.

Year

Salaries and

allowances

(Rs. Crores)

Pensions

(Rs. Crores)

Expenditure on Salaries and

Allowances as percentage of

Expenditure on Pensions as percentage of

Net tax revenue

Net revenue

receipts

Total revenue

expendi­

ture

Net tax revenue

Net revenue

receipts

Total revenue

expendi­

ture

1997‐98

25930

6881

27.10

25.06

14.38

7.19

6.65

3.82

1998‐99

28904

10057

27.62

23.38

13.35

9.61

8.13

4.65

1999‐00

31500

14286

24.56

20.77

12.65

11.14

9.42

5.73

2000‐01

27588

14379

20.19

17.81

9.93

10.52

9.28

5.18

2001‐02

29925

14436

22.41

18.84

9.93

10.81

9.09

4.79

2002‐03

31420

14496

19.82

16.74

9.28

9.14

7.72

4.28

2003‐04

32155

15905

17.20

14.93

8.88

8.51

7.38

4.39

2004‐05

35154

18300

15.64

13.94

9.15

8.14

7.26

4.76

2005‐06

37262

20256

13.85

16.64

8.48

7.53

7.41

4.61

2006‐07

39854

22104

11.35

11.54

7.74

6.29

6.40

4.29

2007‐08

44361

21261

10.09

10.16

7.46

4.84

4.87

3.58

2008‐09

67464

32941

15.22

12.49

8.50

7.43

6.10

4.15

2009‐10

89860

56149

19.68

15.69

9.86

12.30

9.80

6.16

2010‐11

88651

57405

15.56

11.24

8.52

10.07

7.28

5.52

2011‐12

95291

56190

15.13

12.68

8.32

8.92

7.48

4.90

2012‐13

111878

63183

15.11

12.75

9.00

8.54

7.20

5.08


03.13.               The  ratios  of expenditure  on  salaries  and  pensions  to revenue receipts and expenditure are much lower for the Centre as compared with the State. This is because of the fact that the States are assigned more functional responsibilities than the Centre under the Constitution necessitating higher deployment  of  personnel  in  relation  to  revenue.  Added  to  this,  there  is  a vertical imbalance in the revenue of the States and the Centre. On an average the Centre collects nearly 63 percent of the combined  tax revenue. Thus, the


lower ratios of salary and pension expenditure of the Centre are reflective of its higher resource base. Between 1997‐98 and 2007‐08, the ratio of expenditure on salaries and pensions of the Centre to net revenue receipts declined by one‐ third from 25.06 percent to 8.53 percent. The sharp increase witnessed in the years 2008‐09 and 2009‐10 is on account of the implementation of the recommendations of the Sixth Central Pay Commission and payment of arrears. After the absorption of the impact of the Sixth Pay Commission, the expenditure on  salaries  and  pensions  of  the  Central  Government  constitutes  only  12.75 percent of net revenue receipts in 2012‐13, while such percentage for the State is 54.93.

Debt Servicing Burden

03.14.                The State raises debt every year to meet its plan expenditure. The loans raised by the State Government amounted to Rs.30,537 crore in 2013‐14 (RE). One of the important indicators of debt sustainability is the ratio of debt redemption (repayment + interest payments) to total debt raised in a year. The ratio of debt redemption to fresh debt raised in a year indicates the net debt available to the State. The higher the ratio, higher will be the borrowings of the State to meet the gap in its resources. The following table presents the trends in the debt redemption ratios (Table‐6)

Table­6: Trends in Debt Redemption Ratios.(Rs.in Crores)

Debt

06­07

07­08

08­09

09­10

10­11

11­12

12­13

13­14 (BE)

Internal Debt of the State Government


Loans raised

4236

10223

14956

18185

16478

16731

22128

30537

Repayments and interest payments

3526

4664

4745

5565

6997

6590

7433

12248

Net loan available

710

5559

10211

12620

9481

10141

14695

18288

Debt redemption ratio

0.83

0.46

0.32

0.31

0.42

0.39

0.34

0.40

Loans from GOI


Loans raised

315

909

397

1569

2244

2719

1183

2693

Repayments and interest payments

2437

1978

1936

2584

2630

1919

2087

2011

Net loan available

‐2123

‐1069

‐1539

‐1016

‐386

800

‐904

682

Debt redemption ratio

7.75

2.18

4.88

1.65

1.17

0.71

1.76

0.75


03.15.               During the year 2006‐07, the debt redemption ratio in respect of internal debt was very high at 0.83 indicating that repayments and interest payments constituted 83 per cent of fresh loans. In the case of loans from the Centre, there is a reverse flow of resources in most of the recent years because termination of plan loans to states since 2005‐06.  There has been a moderation


in the redemption ratios in recent years mainly because of policy interventions. These include debt swap scheme under which the States were allowed to swap their  high  cost  debt  by  low  cost  additional  market  borrowings,  debt consolidation   and   relief   facility   (DCRF)   and   interest   reset   on   high   cost borrowings from the National Small Savings Fund (NSSF) following the recommendations of the  Twelfth Finance Commission.   Though the current redemption ratio for internal debt is about 0.40, it is unlikely that the lower redemption ratio will continue as nearly 48 percent of the outstanding market loans are due for repayment in the next five to seven years.


03.16.             Apart from the debt‐redemption  ratios, the Central Finance Commissions have been recommending certain desirable ratios with a view to maintaining debt sustainability. The Eleventh Finance Commission (2000‐05) considered that interest payments as a proportion of revenue receipts of States should  not  exceed  18  percent  for  maintaining  a  sustainable  debt  level.  The Twelfth  Finance  Commission   (2005‐10)  felt  that  a  debt‐GSDP   ratio  of  28 percent would be consistent with sustainable debt levels. The Commission also felt that ideally interest payments as a percentage of revenue receipts should stabilize around 17 percent. The Thirteenth Finance Commission (2010‐15) considered  that  a  debt‐GSDP  ratio  of  25  percent  for  all  States  was  feasible. There has been a moderation in the ratios of interest payments to revenue receipts and debt‐GSDP ratio. These are currently within the limits considered sustainable by the Central Finance Commissions (Table‐7). As indicated earlier, the improvement was mainly on account of debt swap scheme, DCRF, reduction of interest rate on outstanding loans from NSSF, the effect of which has started tapering off. The bunching of repayments of market borrowings in the next five years will exert pressure on the debt sustainability ratios.

Table­7: Debt Sustainability Ratios in Andhra Pradesh(Rs. in Crores)

Debt

06­07

07­08

08­09

09­10

10­11

11­12

12­13

13­14 (BE)

Interest

Payments

7280

7589

8057

8914

9675

10561

11662

14519

Revenue

Receipts

44245

54143

62858

64678

80996

93554

103830

127772

Interest Payments as Percentage of Revenue Receipts (%)

16.45

14.02

12.82

13.78

11.94

11.29

11.23

11.36

Outstanding

Debt

75400

82479

93568

108006

121744

135653

152465

179638

GSDP at

Current Prices

301035

364813

426765

476835

570992

655181

745782

858959

Outstanding Debt as Percentage of GSDP (%)

25.05

22.61

21.93

22.65

21.32

20.70

20.44

20.91


03.17.               As observed  by the Reserve  Bank of India (RBI) in its Study of State   Budgets   for  the   year   2013‐14   the   conventional   debt   sustainability analysis though useful may not provide a comprehensive assessment of debt sustainability   as  it  is  based  on  a  narrow  coverage  of  debt  and  excludes contingent implicit and off‐budget liabilities. Apart from issues of debt coverage this analysis is generally done in a static framework and therefore it does not account for fiscal and economic behaviour in response to shocks (sensitivity analysis) and fiscal vulnerabilities (stress‐testing exercise).

03.18.               Apart  from  the  Government  guarantees  there  are  likely  to  be contingent liabilities on account of projects under public‐private partnerships (PPP). Faced with resource  constraints  and growing  infrastructure  needs the State Government is constrained to undertake investment projects through PPP route. Two types of liabilities will arise on account of PPP projects. These are both current and deferred liabilities as well as contingent liabilities arising on account of guarantees issued to Special Purpose Vehicles (SPV) or State undertakings   to  facilitate   borrowings   by  them.  The  explicit   and  deferred liabilities  in  the  case  of  PPP  projects  arise  from  annuity  payments  over  a number of years. PPP projects may also result in contingent  liabilities arising out of obligations to compensate private sector partners in the event of changes in specifications breach of obligation or termination of contract. The traditional debt sustainability ratios do not capture these liabilities. The number of PPP projects currently under implementation in the State is 169 with an estimated investment of over Rs.58000 crore. Another 37 projects are in the pipeline with an investment of Rs.8000 crore.


03.19.               Another major liability for the State Government is on account of its participation in the financial restructuring plan (FRP) of power distribution companies. The fiscal implications of the FRP for participating states are linked to  four   major   aspects:   (i)  issuance   of  bonds   by  the  state‐owned   power distribution companies (discoms) with respect to 50 per cent of short‐term liabilities (STL) as on March 31 2012 and its subsequent replacement through issuance of special securities by the state governments and  (ii) issuance of guarantees towards interest and principal repayment of the balance 50 per cent of STL to be restructured by banks/FIs governments arising from their participation.

Subsidies

03.20.               The subsidy burden of the State Government is significant and is increasing  year  after  year  on  account  of  the  continued  focus  on  inclusive growth  extension  of the coverage  of the existing  subsidy  scheme  and introduction of new schemes. Food subsidy to Andhra Pradesh Transmission Corporation  (APTRANSCO)  and  fee  reimbursement  and  payment  of scholarships are the major subsidy schemes being administered by the Government of Andhra Pradesh. The food subsidy is on account of distribution of Re.1 per kg. rice to 2.35 crore families in the State. Subsidy to APTRANSCO is on account of supply of free electricity to farmers. Under the fee reimbursement


scheme introduced in 2008 students belonging to weaker sections pursuing professional courses are reimbursed tuition fees. The expenditure on these schemes had increased from Rs.6,939 crore in 2008‐09 to Rs.12,296  crore in

2013‐14 (Table‐8).

03.21.               During the year 2013‐14 the Government had introduced a new scheme  called “Amma Hastam”.  Under the scheme essential  commodities  are being supplied in a package for Rs. 185 per month. The package includes one Kg. of toor dal one litre of palm oil one kg. of whole wheat atta one kg. of wheat half  a  kg.  of  sugar  one  kg.  of  salt  quarter  kg.  of  chilli  powder  half  a  kg.  of tamarind and 100 grams of turmeric powder. The expenditure on this scheme is estimated at over Rs.400 crore in 2013‐14. The State Government introduced another unique scheme called “Bangaru Talli” aimed at emancipating the status of the girl child eliminating the practice of female feticide and eradicating trafficking in girl children. To give statutory backing the State Government enacted the Andhra Pradesh Bangaru Talli Girl Child Promotion and Empowerment  Act in June 2013. The scheme envisages periodic payments to the girl child right from her birth to the completion of collegiate education. This is likely to impose  additional burden on the exchequer.

03.22.               The  implementation  of  the  Right  to  Food  Act  is  estimated  to impose an additional financial burden of over Rs.1000 crore per annum on the State Government.

Table­8: Expenditure on Major Subsidies by the State Government(Rs.in Crores)

Type of subsidy

06­07

07­08

08­09

09­10

10­11

11­12

12­13

13­14 (RE)

Power subsidy

1367

1175

3385

3212

3646

4300

6178

5700

Rice subsidy

704

880

2201

2350

2250

2280

2500

3000

Scholarships

332

555

815

760

504

781

887

618

Reimbursement of Tuition Fee


0


120


538


719


1764


2433


3173


2979

Total

2403

2730

6939

7041

8164

9794

12737

12296

Expenditure on major subsidies as % of

Revenue

Expenditure


7.17


6.20


12.09


12.50


11.91


11.64


13.35


11.13

Human Development Index


03.23.                The  accepted  norm  of what  constitutes  economic  development had   undergone   a   paradigm   shift.   The   concept   of   development   is   now considered to be more comprehensive and goes beyond the mere material dimension  of  increase  in  per  capita  income  and  is  complemented  by  non‐ material   dimensions   like  education   health  and  access  to  basic  amenities. Average per capita income has no meaning if people lack basic education health and   minimum   standard   of  living.   Human   Development   Index   (HDI)   is  a


comprehensive index that measures the overall status of a State in terms of education  knowledge  and  standard  of  living.  Further  as  recognized  by  the United Nations Development Programme (UNDP) the HDI which is basically an average across the three dimensions of health education and income conceals disparities in human development across population within a State. Two States with different distributions of achievements can have the same average HDI.


03.24.               The inequality adjusted HDI (IHDI) computed by the UNDP takes into account not only the average achievements of a State on these three parameters but also how these achievements are distributed among its citizens by discounting  each  dimension’s  average  according  to its level  of inequality. The IHDI for 19 major States computed by the UNDP are presented in the table below (Table‐9). Andhra Pradesh ranks 12th among 19 states and below the southern States of Kerala, Karnataka and Tamil Nadu.It is a matter of concern that the IHDI in the State is even lower than that States like West Bengal Assam Himachal  Pradesh  and  Uttarakhand.  This  is  indicative  of  the  imperative  to improve the HDI in the State by improving education and health facilities.

Table­9: Inequality Adjusted Human Development Index

State

Human

Development

Index (HDI)

Inequality Adjusted

Human Development Index (IHDI)

Rank

HDI

Rank

IHDI

Andhra Pradesh

0.485

0.332

11

12

Assam

0.474

0.341

12

11

Bihar

0.447

0.303

18

16

Chhattisgarh

0.449

0.291

17

18

Gujarat

0.514

0.363

8

7

Haryana

0.545

0.375

5

6

Himachal Pradesh

0.558

0.403

3

3

Jharkhand

0.464

0.308

15

14

Karnataka

0.508

0.353

10

9

Kerala

0.625

0.520

1

1

Madhya Pradesh

0.451

0.290

16

19

Maharashtra

0.549

0.397

4

4

Orissa

0.442

0.296

19

17

Punjab

0.569

0.410

2

2

Rajasthan

0.468

0.308

14

13

Tamil Nadu

0.544

0.396

6

5

Uttar Pradesh

0.468

0.307

13

15

Uttarakhand

0.515

0.345

7

10

West Bengal

0.509

0.360

9

8

India

0.504

0.343


Source: UNDP: Inequality Adjusted Human Development Index for India’s States­2011

Conclusion

03.25.                The analysis presented  above brings out the fact that there has been a turnaround in the State finances and economy since 2003‐04 facilitated by  the  enactment  of  the  FRBM  Act  and  introduction  of  VAT  and  favourable global economic situation. The momentum in growth and improvement in State finances  suffered  a  setback  following  the  global  downtrend   and  domestic


supply constraints and the resultant slowdown in revenue collections and transfers from the Centre.


03.26.               There has been a significant fall in the poverty ratios in the State. The overall poverty ratio in the State is 9.20 percent which is much below the nationals average of 21.92 per cent in 2011‐12.   It is a matter of concern that the increase in the per capita income and reduction in the poverty levels in the State have not translated  into an improvement  in the HDI. Ensuring  that the fruits of development result in an improvement in HDI is a major challenge for the State.


03.27. The recent deceleration in growth of the economy is of serious concern. Putting the growth momentum back on track will remain the major task of the State  Government.    So  far  the  State  finances  have  remained  sustainable  but there are incipient signs of stress. The commitments  of the State Government are likely to increase significantly following the introduction of new welfare schemes   liabilities   on   account   of   PPP   projects   financial   restructuring   of DISCOMS  and  implementation  of  Right  to  Food  Act.  The  proposed reorganization of the State is likely to result in additional commitments.


03.28. In the context of the growing commitments of the State the Commission has to tread the fine line between economic rationale and the aspirations of the employees and arrive at a judgment on how much of the State’s resources can be  spared  for  providing   for  an  increase   in  the  salaries   and  pensions   of employees.  Despite the constraints  the Commission  is of the considered  view that  reasonable  increases  are  necessary  to  attract  talented  people  to government   service   to   retain   them   and   to   nurture   in   them   a  sense   of commitment to public service. We have tried to strike a balance between the welfare of the people and the need for a fair and reasonable increase in pay and allowances.  Our recommendations  have been formulated  keeping in view the need for meeting the legitimate aspirations of the employees without compromising on the responsibilities of the State towards the welfare of its people.


CHAPTER IV APPROACH TO PAY REVISION


04.01                The Pay Revision Commissions have in the past laid down several principles to be followed for evolving the pay structure of government servants. The Varadachariar Commission (1946‐47) introduced the principle that as a matter of policy the lowest rate of remuneration  should not be lower than a “living  wage”  and  that  the  highest  salaries  should  also  as  a matter  of social policy be kept down as far as possible consistent with essential requirements of recruitment and efficiency. The minimum and maximum having been so determined, the intermediate salaries were fixed by the Commission largely on considerations of maintaining or establishing satisfactory vertical relativities within a service or a hierarchy of services, and horizontal relativities between one set of services and another.       TheSecond  Central Pay Commission  (1957‐

58) observed  that in the matter of minimum  wage, the requirement  of social

policy was that an employee should be assured of the satisfaction of certain human and social needs, and in regard to the highest salaries, the requirement is  that  the  salaries  should  while  be  sufficient  to  attract  persons  with  the requisite talents and qualifications, and to retain them in service with their efficiency and keenness unimpaired, need not be such as would compare with the highest salaries in outside employments. The Commission was of the view that  “sound  and equitable  internal  relativities  should  be the most  important single principle to be followed in the determination of intermediate salaries”.


04.02                The Third Central Pay Commission (1970) held the view that pay determination  should  take into account  the initial qualifications,  the training and  skill,  and  the  physical  and  intellectual  endowments  which  the  person brought to bear on the post.    Further, the difficulty and complexity of the task to be performed as well as the responsibility to be undertaken should be given considerable   weight.  The  third  Pay  Commission   went  beyond  the  idea  of minimum subsistence that was adopted by the first Pay Commission. The commission report says that the true test which the government should adopt is to know whether the services are attractive and it retains the people it needs and if these  persons  are satisfied  by that they  are getting  paid.   The Fourth Central Pay Commission (1983) held the view that the pay of a post should be such as to attract persons of the required qualifications and calibre to fill it and the  pay  also  should  be  sufficient  and  satisfactory  enough  to  motivate  the employee  for  efficient  performance  of  his  duties  and  responsibilities  with  a sense of rectitude.


04.03.             The Fifth Central  Pay Commission  (1994)  reiterated  three characteristics ofa sound pay structure‐inclusiveness, comprehensibility and adequacy. Inclusiveness implied that the broad patterns of pay scales that have been adopted' for the civil services will be uniformly applied everywhere, especially in areas where some autonomy has been provided. Coming next to comprehensibility a pay scale should normally give a total picture of the emoluments   of   a   post,   rather   than   being   fragmented   into   anumber   of allowances.   The   third   requirement    was   that   of   adequacy.   Government


employees  should not have a feeling that their emoluments  were inadequate with respect to their skills, educational qualifications, experience, duties and responsibilities,  but also as compared  to their peers outside the Government. The Sixth Central Pay Commission  (2006) noted that the role of Government itself was undergoing a change from a monopolistic supplier to be that of a facilitator   and   regulator   in   the   various   economic   activities,   and   in   that background  sought  to  devise  a  pay  package  which  would  not  only  provide enough incentive to retain the brightest officers in the Government set up but also attract the best to join it in future.


04.04.               Pay   Revision   Commissions   in   Andhra   Pradesh   have   largely followed  the  accepted  norms  for  salary  determination   evolved  by  various Central Pay Commissions.   The 1978 Commission adopted the broad principle that  services  and  posts  whose  duties  and  responsibilities   are  comparable should,  other  relevant  circumstances  being  the same;  carry  substantially  the same or comparable  rates of remuneration.   The PRC (1986) observed that it was well recognized that in addition to qualifications, pay scales are for duties as discharged and as such the aspects of the nature and breadth of duties, was also important.   The 1993 Commission had no hesitation in holding that educational qualification alone could not serve as an adequate and sole guiding principle or factor in the determination of pay scales.   It held that grouping of posts by the public service commission for conducting examinations etc., for recruitment was merely a matter of administrative convenience and did not constitute  a value  judgment  in regard  to the relativities  of these  posts.   The

1993  Commission  held  the  view  that  the  existing  and  traditional  relativities

both  horizontal  and vertical  could  be used  as the basic  framework,  bringing about  only  essential  changes  needed  to  reflect  significant   changes  in  the functional  content  of  the  various  jobs  and  correction  of  glaring  distortions which   might   have   crept   in   and   that   this   exercise   inevitably   would   be judgemental, based on informed discussions with Associations representing various categories of employees and the Heads of Departments and Secretaries to the State Government.


04.05.               The   PRC   (1999)   held   the   view   that   the   lowest   rate   of remuneration  should  not  be  lower  than  a  living  wage  and  that  the  highest salaries also should be kept down as far as possible as a matter of social policy (i.e. the need to reduce disparities) consistent with the essential requirements of recruitment  and efficiency.    While  there  were  several  definitions  of living wage, a common sense interpretation was that it is one which would enable the employee  to  maintain  himself  and  his  family  of  three  or  four  in  reasonable comfort  and  to  live  in  dignity  as  expected  of  a  person  of  his  official/social status.      The  PRC  (2005)  went  by  the  principle  that  a  sound  pay  structure should satisfy the important norms of inclusiveness, comprehensibility and adequacy, and of fixing the scales based on qualifications prescribed for recruitment.  The  Commission  also  sought  to  bring  parity  for  similar  posts having similar qualifications and scales.  The PRC 2010 observed that over a period of time certain relativities had been established and a hierarchical structure   had  also  been  built  up  in  the  pay  scales,   but  then  every  Pay Commission had to face the dilemma of maintaining either the existing parities


or alter some of the parities depending upon the changing needs of the Government  and  perceptions  about  the  availability  of  the  skilled  manpower and   the   ability   of   the   Government   to   attract   those   skilled   people   into Government service.


04.06.               The  Pay  Revision  Commissions  also  assess  the  changes  taking place in priorities of Government which find expression in the form of new schemes, the mechanism for implementation of these schemes, the availability of  qualified  manpower   to  achieve  the  objectives  of  the  schemes  and  the incentives  to  be  built  in  through  an  appropriate  pay  structure  to  enthuse existing incumbents and attract new talent into the service.  In this process the pay scales get revised and the parities that once existed in pay may get altered and this sometimes leads to representation from employees of anomaly in pay scales. Other issues generally raised by most associations relate to variation in pay structure at the entry level in uniformed and technical services, in services recruited through a common entrance examination, and in allied services.  The representations seeking parity in scales are based on similar academic qualifications, and the size of the territorial jurisdiction etc.  These issues have been held not to be valid as academic qualifications alone cannot constitute the basis  for  determination  of  pay  because  conduct  of  common  entrance examination  can  be a matter  of convenience  and  not be the  justification  for equal pay and that territorial jurisdiction is determined with reference to the intensity and quality of work and not be a bench mark for pay scales etc. What determines the pay scale ultimately is a combination of many factors.


04.07.               This Commission has followed these principles to a great extent in evolving the new pay structure for the employees.  In our view, pay structure of posts  should  be such  as to inspire  persons  of required  qualifications  and calibre to fill it and be sufficient to motivate the employee for efficient performance of his duties and self‐fulfilment of responsibilities.  Minimum pay has to be fixed at a level as would enable the employee to maintain himself and his family in reasonable comfort and to live in dignity as expected of a person of his official  / social status.  This commission  has within the framework  of ILC norms  incorporated 10 per cent of the expenditure on food, clothing and other miscellaneous  items   in minimum  pay to neutralise  the cost to employees  of new  items  of  expenditure  like  transport,  education,  household  accessories, mobile phone and  Internet usage etc., in addition to recreation and festivals.


04.08.               This Commission has used the existing and traditional relativities both horizontal and vertical in the pay structure of different sets of government employees  as  the  basic  framework,  bringing  about  only  essential  changes needed to reflect the changes, if any, in the entry level qualifications, to rectify anomaly  and/  or  to  maintain  two  stage  step  up  for  promotion  posts  falling under the ambit of Automatic Advancement Scheme.


04.09.               The Commission has narrowed down the variations in salaries of employees   similarly   placed,   more   so   in   Group‐I   and   II   services   where recruitment is done through APPSC. Similarly, gap in pay at the entry level is narrowed, though not completely eliminated, for many technical services such


as Medicine, Engineering, Legal, Agriculture etc.    Pay scale at the level of Joint Director / Deputy Director/ Assistant Director is largely kept at the same level across the Departments, to bring in harmony in inter‐departmental functioning. We have also sought to rationalise the pay structure of the non‐ cadre Heads of Departments and of the Additional Directors where the post of the HOD is occupied by Cadre officers, to provide ample opportunity for growth within the Department. Important  factors considered while fixing the Scales of Pay for the HOD and the Additional Directors are a) the span of jurisdiction; b) number of Unit Officers; c) Budget handled; d) number of employees in the Department; and e)degree of interaction withstake holders, viz    public, non‐officials, government agencies etc.


04.10.             The  Task  Force  appointed  for  evolving  pay  structure  for Engineering  Departments  did  a commendable  work  in  articulating  the aspirations of Engineers for a better scale of pay at the entry level and we have substantially  accepted  its recommendations.  However,  in doing so we had to give up the traditional one stage difference   in the scale of Pay of Assistant Engineer (AE) and Assistant Executive Engineer(AEE)  at the entry level.


04.11.               This  Commission  spent  considerable  time  in  analysing  the  pay structure of uniform staff, particularly in Police, Prisons, Fire, Forest, Transport and Excise Departments and improved the scales of pay at various levels. The major  challenge   was  to  fix  the  pay  at  the  initial  level  of  Constable   and equivalent. In the Departments, where the entry level qualification of Constable and equivalent is raised to Intermediate,   we have harmonised the pay scale by allowing  stage  improvements.  In the Department  of Forest  and Excise,  entry level pay of constables  can be brought  on par with other uniformed  services only when the entry level qualification is likewise enhanced.


04.12.                In   the   Medical,   Health   and   Family   Welfare   Department,   a significant decision taken is to narrow down the difference in the pay scales of Doctors working in AYUSH Department,  Visa Vis., the Medical Department  on the allopathic side.    This has been done keeping in mind the similarity in the course content and duration of studies at the graduate as well as the P.G.levels and to give  due importance to the Indian System of Medicine.  Panchayat Raj is yet another department that has received our due attention in the revision of pay scale, to give to the post of Panchayat Secretariesadequate importance that it deserves for improving the local self governance.


CHAPTER V


RECOMMENDED PAY SCALES


05.01.               The  Pay  Revision  Commission  1993  introduced  the  concept  of

‘Master Scale’ for the first time. This has the advantage of a single running scale for the entire gamut of the State employment, individual scales assigned to the posts  /  categories  being  merely  segments  thereof  and  the  merit  of predictability.  For  determining  the  Master  Scale,  factors  taken  into consideration are i) Minimum and Maximum pay; ii) Number of pay scales; iii) Span of pay scales at various  levels; iv) Rates of increments; and v) Inter – scale relativity. This concept of ‘Master Scale’ is being continued with slight modifications  from time to time by the successive Pay Revision Commissions. This time also the employees and their associations have overwhelmingly endorsed for the continuation of ‘Master Scale’, with minor modifications.


05.02.               Following the earlier precedent, this Commissionrecommends the  continuation  of  ‘Master  Scale’,  and  suggests  in  the  following paragraphs a new scale of pay for adoption.Inthe new scale we have ensured that  there  is a reasonable  increase  in the quantum  of increment  in absolute terms  so  that  at  no  point  the  employee  would  face  a  situation  of  reduced quantum of increment as a result of fixation of pay in the revised pay scales and that the quantum of increment is not only reasonable but also attractive.   We have also increased the span of the scales to accommodate people with long service so that they would not stagnate and will continue to get the benefit of increments. In the event of stagnation which should not normally arise, we recommend grant of up to five stagnation increments.


Minimum Pay:


05.03.                Majority   of  Employees’   Associations   have   suggested   for   the fixation  of ‘Minimum  Pay’  ranging  from  Rs.10000/‐per  month  to Rs.16150/‐ per month adopting the norms evolved by the 15th  International Labor Conference.   However, in doing so some Associations have calculated the minimum pay by taking 4 members   into account in a family unit and not 3 as earlier,   on  the   ground   that     the   maximum   age   of  recruitment   into   the government  service  had  been  enhanced  to  36‐43  years,  and  many  people having wife and two children were now entering the service.


05.04.            The   A.P.   Secretariat   Employees   Federation   has   in itsmemorandum stated that a sound salary system needs to possess (a) inclusiveness,   (b)   comprehensibility,   and   (c)   adequacy   both   internal   and external. The pay structure needs to be commensurate with the degree of skill, responsibility undertaken, mental and physical requirement, minimum educational qualifications and promotional avenues etc.  Hence the request is to adopt better scientific   reasons/ criteria in arriving at the minimum basic pay and also a good master scale that takes care of the needs of the employees in future also.    It is further stated in the Memorandum that per capital income of the state Government is doubled in a span of five years from Rs.33,135/‐ during


2006‐07 to Rs.68,970/‐ in 2011‐12. The same is at Rs.77,277/‐ per annum at current prices for the year 2012‐13. The nuclear family consisted of husband and wife, two children and a dependant parent.  The per capita income for five members come to Rs.3,86,385/‐ per annum or an  amount of Rs.32,199/‐ per month.     Hence  income  of a low paid  employee  cannot  be less than  the per capital  income  and  suggested  for    a    minimum  pay  of  Rs.16,000/‐    and    a maximum  of Rs.1,65,850/‐  and a fitment of 75%.


05.05.               The   Telangana   Gazetted   Officers   Central   Association   has worked out the ‘Minimum Pay’ by following three different methods, namely, Expenditure method, Calorie intake method and Income method and arrived  at Rs.15,000/‐  to  be  fixed  as  Minimum  Pay.    According  to  the  Association  the monthly per capita expenditure of the household with four members as family worked   out   to  Rs.14,703/‐   and   hence   it  was   essential   to  have   at   least Rs.15,000/‐ as Minimum Pay with the fitment of 69.10%.


05.06.               The TNGOs  Central   Union  has while  reiterating  similar  facts, have taken 4 members in a family unit for calculating the minimum pay and suggested   for a   minimum pay of Rs.15,000/‐   and   a maximum   scale of Rs.1,25,640/‐ with a fitment of 69.10%.


05.07.               The Telangana Girijan Upadya Sangam (TGUS) have suggested a Minimum Pay of Rs.15,500/‐ and the Maximum Pay of Rs.1,46,000/‐   with a fitment of 80%.The Telangana Teachers Federation (TTF) have suggested a Minimum   Pay  of  Rs.14,850/‐   and  the  Maximum   Pay  of  Rs.1,33,020/‐   by proposing at least four members as a family instead of three members.    The fitment proposed is 60% with effect from 1.7.2013.The Telangana United Teachers’  Federation     have  in  their  Memorandum   proposed  adoption  of Master Scale with a Minimum Pay of Rs.15,250/‐   and Maximum   Pay of Rs.1,16,770/‐,  with a fitment of 56%. The Progressive Recognized Teachers Union Telangana have similarly proposed Minimum Pay of Rs.15,500/‐ and  a Maximum   Pay  of     Rs.1,46,000/‐   with  a  fitment   of  70%.  The  Telangana Regional Teachers Union have calculated the need based Minimum Pay of Rs.15,950/‐ to be fixed as Minimum Basic Pay and a Maximum Pay of Rs.1,29,350/‐  with  a fitment  of 75%.  The Dalitha  Girijana  Teachers  Union have demanded a Minimum Pay of Rs.14,720/‐ and a Maximum Pay of Rs.1,38,140/‐ with ratio of 1:9.4 between the Minimum and Maximum Pay.


05.08.               The   A.P.   Teachers   Federation   in   their   representation   has mentioned  that  the  prices  of  consumer  items  were  on  higher  side  in  open market as in March, 2013,   when compared to Labour Bureau prices.  The cost of cooking  gas and house rents, medical  reimbursements  and electricity  may have to be taken into consideration, while determining minimum pay of the employee. For the above items 15% more expenditure is required.  Taking into consideration the family unit as comprising of 4 members, the request is  tofix Rs.15,000/‐   as a minimum pay and Rs.1,22,300/‐ as the maximum pay, with a fitment of 69%.


05.09.              The P.R.T.U, Hyderabad in their representation has stated that minimum requirement of pay for the lowest employee would be around Rs.14,200/‐ per month by taking into account the prevailing cost of essential commodities   as  on  1/2/2013  which  included  the  cost  of  Gas  Cylinder  of Rs.415/.  The Union suggested    for adoption of a 3 member family as one unit and for a ratio of minimum and maximum pay to be 1:9.7 (14,200 : 1,37,620) with fitment @ 60%.   The A.P.U.T.F in their representation  have suggested to take 4 member family as one unit and calculated minimum needs of a family to be Rs.19,600/‐ pm, inclusive of Electricity, Fuel, expenditure on Education and Health. However, it requested for Rs.15,000/‐ pm fixed as a minimum pay and Rs.1,41,330/‐ pm to be the maximum pay. The ratio between minimum and maximum  pay  is proposed  to  be  1:9.42  and  fitment  for   pay  fixation  in  the revised pay scales 2013 to be @ 60 %.The STU AP in their representation has after inclusion of rates of Fuel charges, Electricity charges, Transport charges and   Medical   expenditure   determined   the   minimum   pay   to   be   fixed   as Rs.15,200/‐  pm and suggested   a ratio between  minimum  pay and maximum pay to be 1 : 9.56  and fitment @ 62%.


05.10.               The  A.P.N.G.Os  association  in  their  representation,  has  stated that recent trends of human necessities and living conditions have not  been reflected  in the earlier  method  of calculation  of Need Based  Minimum  Wage and the method adopted by Indian Labour Organization during the year 1960 is being  followed even now which is not practical. Keeping in view of the recent trends in living conditions, they have arrived at the Need Based Minimum Wage of Rs.15,000/‐ P.M, duly taking into 3 members of family as one unit.  They have proposed to include Latest essential items i.e Education, medical expenses, cell phone, Transport, Drinking water, Gas, electricity and House rent. They have proposed for Master Pay scale concept, with a minimum pay of Rs.15,000/‐p.m. and a maximum pay of Rs.1,37,600/‐ p.m. (ratio  being 1 : 9.17) with 32 grades and 80 segments. They have also proposed for a fitment of 69% and increments ranging from 2.198% to 3%.


05.11.               The Udyogakranti has worked out the minimum pay duly taking

4  members  of  family  as  unit,  taking  into  2600  calories  in  taking,  shelter, clothing and expenditure on education. The minimum pay is suggested as Rs.20000/‐ and the maximum pay is Rs.161300/‐ per month, duly taking in to account  60% DA as on 1‐7‐2013.  The ratiobetween  minimum  and maximum pay being 8.065% and also suggested for continuation of master scale concept with 32 grades.


05.12.               Majority     of     the     employees     associations     have     in     their representations recommended for the adoption of ILC norms for calculating the Minimum Pay, with some modifications.  The modifications  proposed are i) to take  4  members   in  a  family   unit  instead   of  3,  as  the  minimum   age  of recruitment into the Government service had been increased and many people having  two  children   were  now  entering   the  Government   service,   and  ii) Inclusion in the minimum pay calculation of new items of expenditure such as fuel, electricity, cooking, gas, internet and cell phone, water etc., as additional


expenditure  on these items had become inevitable and part of the day to day life.


05.13.               This Commission has accordingly decided to follow the ILC norms for determining the need based ‘Minimum Pay’. We have not agreed to increase the size of the family unit from 3 to 4 for minimum pay calculation as increase in the age for recruitment into the Government service is only a concession and this will keep changing from time to time and only a very small proportion of new entrants belong to the extended entry age group.  In so far as new items of expenditure are concerned, we find that there is a substantive ground to inbuilt into the Minimum Pay structure, the additional expenditure now being incurred by  employees  on  new  items  such  as  transport,  education,  household accessories, mobile phone and internet usage etc. We have accordingly incorporated  in the Minimum  Pay structure, 10% of the total expenditure  on food and clothing and other miscellaneous items towards these new items of expenditure, in addition to recreation and festivals.


05.14.               The   table   below   shows   the   calculation   of   the   need   based minimum wage after incorporating the above change:


Need based Minimum Wage


Items @


Per Day

PCU (in gms)

Per

Month 3

CU (in Kg)

Price per KG as per rates on

01.07.2013 (In Rupees)

Total cost per month (as on

01.07.2013) (In Rupees)

Rice

475

42.75

34.99

1495.82

Dal Toor/Urad/Moong

80

7.2

73.99

532.73

Raw Vegetables

100

9.00

34.39

309.51

Green Leaf Veg

125

11.25

32.20

362.25

Other Veg Onion,Potato, Tomato

75

6.75

24.75

167.06

Fruits

120

10.8

71.38

770.90

Milk (18 Ltrs)

200 ml

18

37.44

673.92

Sugar/Jaggery

56

5.00

41.66

208.30

Edible Oil

40

3.6

138.67

499.21

Fish


2.5

272.86

682.15

Meat


5.00

395.55

1977.75

Egg


90

3.67

330.30

Detergents etc., Bath & washing soap, washing powder etc.,


329.25

329.25

Clothing#

5.5 mtrs per month

5.5

271.17 Per Mt.

1491.43

Total


9830.58

Misc.* @20%


1966.11

Total


11796.69

Addl.Expr. ** 10%


1179.67

Minimum Wage


12976.36  or

say 13,000

PCU =  Per Day Consumption Unit


3 CU = Three Consumption Unit

* = 20% Miscellaneous charges towards fuel, gas, electricity, water etc.

** =Includesexpenditure on new items viz. transport,education, household accessories, mobile phone and  Internet usage etc., in addition to recreation and festivals.

#Clothing as prescribed is 70 yards per year.  This works out to about 5.5 mts per month and the cost includes the ancillary charges like stitching etc.

The Commission therefore recommends the minimum pay for the lowest paid employees to be Rs.13,000/­ per month as on 1.7.2013.

Maximum Pay

05.15.               The Employees’ Associations have suggested a ratio ranging from

1:7.3 to 1:10 between the minimum and maximum pay.   For working out the

‘Maximum   Pay’,   the   Commission   has   kept   in   mind   the   following   three principles:

a)   Annual increment to range from 3% of the pay in initial stage to 2.33%

finally.

b)  Existing   quantum   of  increment   to  be  nearly   doubled   in  line  with increase of pay; and

c)   Periodicity of increase in increment to be 3 years;


05.16.               The Commission accordingly worked out a ‘Maximum Pay’ of

Rs.1,10,850/­, which represents a Minimum to Maximum ratio of 1:8.527.

Master Scale and its Segments:

05.17.               The minimum and the maximum having been fixed the issue now for  consideration  is  the  number  of  scales  which  areto  be  carved  out  of  the Master Scale and the span of each one of the scales.Keeping in view the predominant   view   of   employees,   the   Commission   recommends   the

‘Master  Scale’  to  comprise  of  32  grades  and  80  segments.     Since  the tradition in the State has been to revise the pay every five years, the DA sanctioned  as on 1/7/2013  is subsumed  in the Revised  Pay Scale.   The new  Master  Scale  recommended  by this  Commission  for adoption  from

1/7/2013 is as follows:

Rs.13000­390­14170­430­15460­470­16870­510­18400­550­20050­590­

21820­640­23740­700­25840­760­28120­820­30580­880­33220­950­

36070­1030­39160­1110­42490­1190­46060­1270­49870­1360­53950­

1460­58330­1560­63010­1660­67990­1760­73270­1880­78910­2020­

84970 – 2160– 91450– 2330­ 100770­2520–110850(80)


05.18.  A comparative statement giving the existing Master Scale and the corresponding  segments  in the revised  Master  Scale and the span of each of these scales is given in the following table.


Grade

EXISTING SCALE ­ 2010 (Rupees)

Grade

REVISED SCALE ­ 2014 (Rupees)

Master

Scale

6700­200­7300­220­7960­240­

8680­260­9460­280­10300­300­

11200­330­12190­360­13270­390­

14440­420­15700­450­17050­490­

18520­530­20110­570­21820­610­

23650­650­25600­700­27700­750­

29950­800­32350­850­34900­900­

37600­970­40510­1040­43630­

1110­46960­1200­51760­1300­

55660 (80)


13000­390­14170­430­15460­470­

16870­510­18400­550­20050­590­

21820­640­23740­700­25840­760­

28120­820­30580­880­33220­950­

36070­1030­39160­1110­42490­

1190­46060­1270­49870­1360­

53950­1460­58330­1560­63010­

1660­67990­1760­73270­1880­

78910­2020­84970­2160­91450­

2330­100770­2520­110850 (80)

I

6700‐200‐7300‐220‐7960‐240‐8680‐

260‐9460‐280‐10300‐300‐11200‐

330‐12190‐360‐13270‐390‐14440‐

420‐15700‐450‐17050‐490‐18520‐

530‐20110(40)

I

13000‐390‐14170‐430‐15460‐470‐

16870‐510‐18400‐550‐20050‐590‐

21820‐640‐23740‐700‐25840‐760‐

28120‐820‐30580‐880‐33220‐950‐

36070‐1030‐39160‐1110‐40270 (40)

II

6900‐200‐7300‐220‐7960‐240‐8680‐

260‐9460‐280‐10300‐300‐11200‐

330‐12190‐360‐13270‐390‐14440‐

420‐15700‐450‐17050‐490‐18520‐

530‐20110‐570‐20680(40)

II

13390‐390‐14170‐430‐15460‐470‐

16870‐510‐18400‐550‐20050‐590‐

21820‐640‐23740‐700‐25840‐760‐

28120‐820‐30580‐880‐33220‐950‐

36070‐1030‐39160‐1110‐41380 (40)

III

7100‐200‐7300‐220‐7960‐240‐8680‐

260‐9460‐280‐10300‐300‐11200‐

330‐12190‐360‐13270‐390‐14440‐

420‐15700‐450‐17050‐490‐18520‐

530‐20110‐570‐21250 (40)

III

13780‐390‐14170‐430‐15460‐470‐

16870‐510‐18400‐550‐20050‐590‐

21820‐640‐23740‐700‐25840‐760‐

28120‐820‐30580‐880‐33220‐950‐

36070‐1030‐39160‐1110‐42490 (40)

IV

7520‐220‐7960‐240‐8680‐260‐9460‐

280‐10300‐300‐11200‐330‐12190‐

360‐13270‐390‐14440‐420‐15700‐

450‐17050‐490‐18520‐530‐20110‐

570‐21820‐610‐22430 (40)

IV

14600‐430‐15460‐470‐16870‐510‐

18400‐550‐20050‐590‐21820‐640‐

23740‐700‐25840‐760‐28120‐820‐

30580‐880‐33220‐950‐36070‐1030‐

39160‐1110‐42490‐1190‐44870 (40)

V

7740‐220‐7960‐240‐8680‐260‐9460‐

280‐10300‐300‐11200‐330‐12190‐

360‐13270‐390‐14440‐420‐15700‐

450‐17050‐490‐18520‐530‐20110‐

570‐21820‐610‐23040 (40)

V

15030‐430‐15460‐470‐16870‐510‐

18400‐550‐20050‐590‐21820‐640‐

23740‐700‐25840‐760‐28120‐820‐

30580‐880‐33220‐950‐36070‐1030‐

39160‐1110‐42490‐1190‐46060 (40)

VI

7960‐240(2)‐8680‐260‐9460‐280‐

10300‐300‐11200‐330‐12190‐360‐

13270‐390‐14440‐420‐15700‐450‐

17050‐490‐18520‐530‐20110‐570‐

21820‐610‐23650(40)

VI

15460‐470‐16870‐510‐18400‐550‐

20050‐590‐21820‐640‐23740‐700‐

25840‐760‐28120‐820‐30580‐880 ‐

33220‐950‐36070‐1030‐39160‐1110‐

42490‐1190‐46060‐1270‐47330 (40)

VII

8440‐240(1)‐8680‐260‐9460‐280‐

10300‐300‐11200‐330‐12190‐360‐

13270‐390‐14440‐420‐15700‐450‐

17050‐490‐18520‐530‐20110‐570‐

21820‐610‐23650‐650‐24950(40)

VII

16400‐470‐16870‐510‐18400‐550‐

20050‐590‐21820‐640‐23740‐700‐

25840‐760‐28120‐820‐30580‐880‐

33220‐950‐36070‐1030‐39160‐1110‐

42490‐1190‐46060‐1270‐49870‐(40)


Grade

EXISTING SCALE ­ 2010 (Rupees)

Grade

REVISED SCALE ­ 2014 (Rupees)

VIII

9200‐260‐9460‐280‐10300‐300‐

11200‐330‐12190‐360‐13270‐390‐

14440‐420‐15700‐450‐17050‐490‐

18520‐530‐20110‐570‐21820‐610‐

23650‐650‐25600‐700‐27000 (40)

VIII

17890‐510‐18400‐550‐20050‐590‐

21820‐640‐23740‐700‐25840‐760‐

28120‐820‐30580‐880‐33220‐950‐

36070‐1030‐39160‐1110‐42490‐

1190‐46060‐1270‐49870‐1360‐53950 (40)

IX

9460‐280‐10300‐300‐11200‐330‐

12190‐360‐13270‐390‐14440‐420‐

15700‐450‐17050‐490‐18520‐530‐

20110‐570‐21820‐610‐23650‐650‐

25600‐700‐27700(40)

IX

18400‐550‐20050‐590‐21820‐640‐

23740‐700‐25840‐760‐28120‐820‐

30580‐880‐33220‐950‐36070‐1030‐

39160‐1110‐42490‐1190‐46060‐

1270‐49870‐1360‐53950‐1460‐55410

(40)

X

10020‐280‐10300‐300‐11200‐330‐

12190‐360‐13270‐390‐14440‐420‐

15700‐450‐17050‐490‐18520‐530‐

20110‐570‐21820‐610‐23650‐650‐

25600‐700‐27700‐750‐29200 (40)

X

19500‐550‐20050‐590‐21820‐640‐

23740‐700‐25840‐760‐28120‐820‐

30580‐880‐33220‐950‐36070‐1030‐

39160‐1110‐42490‐1190‐46060‐

1270‐49870‐1360‐53950‐1460‐58330 (40)

XI

10900‐300‐11200‐330‐12190‐360‐

13270‐390‐14440‐420‐15700‐450‐

17050‐490‐18520‐530‐20110‐570‐

21820‐610‐23650‐650‐25600‐700‐

27700‐750‐29950‐800‐31550 (40)

XI

21230‐590‐21820‐640‐23740‐700‐

25840‐760‐28120‐820‐30580‐880‐

33220‐950‐36070‐1030‐39160‐1110‐

42490‐1190‐46060‐1270‐49870‐

1360‐53950‐1460‐58330‐1560‐

63010‐(40)

XII

11530‐330‐12190‐360‐13270‐390‐

14440‐420‐15700‐450‐17050‐490‐

18520‐530‐20110‐570‐21820‐610‐

23650‐650‐25600‐700‐27700‐750‐

29950 ‐800‐32350‐850‐33200 (40)

XII

22460‐640‐23740‐700‐25840‐760‐

28120‐820‐30580‐880‐33220‐950‐

36070‐1030‐39160‐1110‐42490‐

1190‐46060‐1270‐49870‐1360‐

53950‐1460‐58330‐1560‐63010‐

1660‐66330 (40)

XIII

11860‐330‐12190‐360‐13270‐390‐

14440‐420‐15700‐450‐17050‐490‐

18520‐530‐20110‐570‐21820‐610‐

23650‐650‐25600‐700‐27700‐750‐

29950‐800‐32350‐850‐34050 (40)

XIII

23100‐640‐23740‐700‐25840‐760‐

28120‐820‐30580‐880‐33220‐950‐

36070‐1030‐39160‐1110‐42490‐

1190‐46060‐1270‐49870‐1360‐

53950‐1460‐58330‐1560‐63010‐

1660‐67990 (40)

XIV

12550‐360‐13270‐390‐14440‐420‐

15700‐450‐17050‐490‐18520‐530‐

20110‐570‐21820‐610‐23650‐650‐

25600‐700‐27700‐750‐29950‐800‐

32350‐850‐34900‐900‐35800 (40)

XIV

24440‐700‐25840‐760‐28120‐820‐

30580‐880‐33220‐950‐36070‐1030‐

39160‐1110‐42490‐1190‐46060‐

1270‐49870‐1360‐53950‐1460‐

58330‐1560‐63010‐1660 ‐67990‐

1760‐71510 (40)

XV

12910‐360‐13270‐390‐14440‐420‐

15700‐450‐17050‐490‐18520‐530‐

20110‐570‐21820‐610‐23650‐650‐

25600‐700‐27700‐750‐29950‐800‐

32350‐850‐34900‐900‐36700 (40)

XV

25140‐700‐25840‐760‐28120‐820‐

30580‐880‐33220‐950‐36070‐1030‐

39160‐1110‐42490‐1190‐46060‐

1270‐49870‐1360‐53950‐1460‐

58330‐1560‐63010‐1660‐67990‐

1760‐73270 (40)

XVI

13660‐390‐14440‐420‐15700‐450‐

17050‐490‐18520‐530‐20110‐570‐

21820‐610‐23650‐650‐25600‐700‐

27700‐750‐29950‐800‐32350‐850‐

34900‐900‐37600‐970‐38570(40)

XVI

26600‐760‐28120‐820‐30580‐880‐

33220‐950‐36070‐1030‐39160‐1110‐

42490‐1190‐46060‐1270‐49870‐

1360‐53950‐1460‐58330‐1560‐

63010‐1660‐67990‐1760‐73270‐

1880‐77030 (40)


Grade

EXISTING SCALE ­ 2010 (Rupees)

Grade

REVISED SCALE ­ 2014 (Rupees)

XVII

14860‐420‐15700‐450‐17050‐490‐

18520‐530‐20110‐570‐21820‐610‐

23650‐650‐25600‐700‐27700‐750‐

29950‐800‐32350‐850‐34900‐900‐

37600‐970‐39540 (38)

XVII

28940‐820‐30580‐880‐33220‐950‐

36070‐1030‐39160‐1110‐42490‐

1190‐46060‐1270‐49870‐1360‐

53950‐1460‐58330‐1560‐63010‐

1660‐67990‐1760‐73270‐1880‐78910 (38)

XVIII

15280‐420‐15700‐450‐17050‐490‐

18520‐530‐20110‐570‐21820‐610‐

23650‐650‐25600‐700‐27700‐750‐

29950‐800‐32350‐850‐34900‐900‐

37600‐970‐40510 (38)

XVIII

29760‐820‐30580‐880‐33220‐950‐

36070‐1030‐39160‐1110‐42490‐

1190‐46060‐1270‐49870‐1360‐

53950‐1460‐58330‐1560‐63010‐

1660‐67990‐1760‐73270‐1880‐

78910‐2020‐80930 (38)

XIX

16150‐450‐17050‐490‐18520‐530‐

20110‐570‐21820‐610‐23650‐650‐

25600‐700‐27700‐750‐29950‐800‐

32350‐850‐34900‐900‐37600‐970‐

40510‐1040‐42590 (38)

XIX

31460‐880‐33220‐950‐36070‐1030‐

39160‐1110‐42490‐1190‐46060‐

1270‐49870‐1360‐53950‐1460‐

58330‐1560‐63010‐1660‐67990‐

1760‐73270‐1880‐78910‐2020‐84970 (38)

XX

18030‐490‐18520‐530‐20110‐570‐

21820‐610‐23650‐650‐25600‐700‐

27700‐750‐29950‐800‐32350‐850‐

34900‐900‐37600‐970‐40510‐1040‐

43630 (35)

XX

35120‐950‐36070‐1030‐39160‐1110‐

42490‐1190‐46060‐1270‐49870‐

1360‐53950‐1460‐58330‐1560‐

63010‐1660‐67990‐1760‐73270‐

1880‐78910‐2020‐84970–2160–

87130 (35)

XXI

19050‐530‐20110‐570‐21820‐610‐

23650‐650‐25600‐700‐27700‐750‐

29950‐800‐32350‐850‐34900‐900‐

37600‐970‐40510‐1040‐43630‐1110‐

45850 (35)

XXI

37100‐1030‐39160‐1110‐42490‐

1190‐46060‐1270‐49870‐1360‐

53950‐1460‐58330‐1560‐63010‐

1660‐67990‐1760‐73270‐1880‐

78910‐2020‐84970‐2160‐91450 (35)

XXII

20680‐570‐21820‐610‐23650‐650‐

25600‐700‐27700‐750‐29950‐800‐

32350‐850‐34900‐900‐37600‐970‐

40510‐1040‐43630‐1110‐46960(33)

XXII

40270‐1110‐42490‐1190‐46060‐

1270‐49870‐1360‐53950‐1460‐

58330‐1560‐63010‐1660‐67990‐

1760‐73270‐1880‐78910‐2020‐

84970‐2160‐91450‐2330‐93780 (33)

XXIII

21820‐610‐23650‐650‐25600‐700‐

27700‐750‐29950‐800‐32350‐850‐

34900‐900‐37600‐970‐40510‐1040‐

43630‐1110‐46960‐1200‐48160(32)

XXIII

42490‐1190‐46060‐1270‐49870‐

1360‐53950‐1460‐58330‐1560‐

63010‐1660‐67990‐1760‐73270‐

1880‐78910‐2020‐84970‐2160‐

91450‐2330‐96110 (32)

XXIV

23650‐650‐25600‐700‐27700‐750‐

29950‐800‐32350‐850‐34900‐900‐

37600‐970‐40510‐1040‐43630‐1110‐

46960‐‐1200‐49360 (30)

XXIV

46060‐1270‐49870‐1360‐53950‐

1460‐58330‐1560‐63010‐1660‐

67990‐1760‐73270‐1880‐78910‐

2020‐84970‐2160‐91450‐2330‐98440 (30)

XXV

25600‐700‐27700‐750‐29950‐800‐

32350‐850‐34900‐900‐37600‐970‐

40510‐1040‐43630‐1110‐46960‐‐

1200‐50560 (28)

XXV

49870‐1360‐53950‐1460‐58330‐

1560‐63010‐1660‐67990‐1760‐

73270‐1880‐78910‐2020‐84970‐

2160‐91450‐2330‐100770 (28)

XXVI

27000‐700‐27700‐750‐29950‐800‐

32350‐850‐34900‐900‐37600‐970‐

40510‐1040‐43630‐1110‐46960‐‐

1200‐51760(27)

XXVI

52590‐1360‐53950‐1460‐58330‐

1560‐63010‐1660‐67990‐1760‐

73270‐1880‐78910‐2020‐84970‐

2160‐91450‐2330‐100770‐2520‐

103290 (27)


Grade

EXISTING SCALE ­ 2010 (Rupees)

Grade

REVISED SCALE ­ 2014 (Rupees)

XXVII

29200‐750‐29950‐800‐32350‐850‐

34900‐900‐37600‐970‐40510‐1040‐

43630‐1110‐46960‐1200‐51760‐

1300‐53060 (25)

XXVII

56870‐1460‐58330‐1560‐63010‐

1660‐67990‐1760‐73270‐1880‐

78910‐2020‐84970‐2160–91450‐

2330‐100770‐2520‐105810 (25)

XXVIII

31550‐800‐32350‐850‐34900‐900‐

37600‐970‐40510‐1040‐43630‐1110‐

46960‐1200‐51760‐1300‐53060 (22)

XXVIII

61450‐1560‐63010‐1660‐67990‐

1760‐73270‐1880‐78910‐2020‐

84970‐2160‐91450‐2330‐ 100770‐

2520‐105810 (22)

XXIX

34050‐850‐34900‐900‐37600‐970‐

40510‐1040‐43630‐1110‐46960‐

1200‐51760‐1300‐54360(20)

XXIX

66330‐1660‐67990‐1760‐73270‐

1880‐78910‐2020‐84970‐2160‐

91450‐2330‐100770‐2520–108330 (20)

XXX

37600‐970‐40510‐1040‐43630‐1110‐

46960‐1200‐51760‐1300‐54360 (16)

XXX

73270‐1880‐78910‐2020‐84970‐

2160‐91450‐2330‐100770‐2520‐

108330 (16)

XXXI

41550‐1040‐43630‐1110‐46960‐

1200‐51760‐1300‐55660 (13)

XXXI

80930‐2020‐ 84970‐2160‐91450‐

2330‐100770‐2520‐110850 (13)

XXXII

44740‐1110‐46960‐1200‐51760‐

1300‐55660 (10)

XXXII

87130‐2160‐91450‐2330‐100770‐

2520‐110850 (10)


05.19.               In  the  proposed  scale  the  highest  is  to  be  assigned  to  Law Secretary  besides  Secretaries  of  Legislature,  Additional  Secretaries  to Government and some Heads of Departments.    If the Law Secretary is from Judicial Department, as is the current practice, he will continue to remain in the Scale recommended by the National Judicial Commission and adopted by the States.


CHAPTER VI PRINCIPLES OF FITMENT


06.01.               One of the terms of reference fixed for the PRC is to examine, as to what extent the existing Dearness Allowance may be merged in the pay as to evolve consequent new set of pay scales merging Dearness Allowance therein and suggest the mode of pay in the revised pay scales. Regarding the merger of Dearness  Allowance  with  the  basic  pay,  the  issue  has  been  discussed  in the earlier  chapter.     The  revised  scales  are  worked  out  based  on  merger  of Dearness  Allowance  with  Basic  pay  and  fixation  of  minimum  pay  based  on certain accepted principles which are discussed earlier.  The new master scale is evolved by arriving at the minimum of the scale and the maximum of scale and   working   out   reasonable   increments   at  various   stages   between.      An important aspect of Revised Pay Scales is the ‘Fitment’ formula for determining

the pay of existing employees  in the Revised Pay Scales, to confer reasonable


monetary benefit on the employees.


STU AP


06.02.               The 1978 Pay Revision Commission recommended for weightage

of one increment for every 3 years of service, based on the service rendered by the employees. In subsequent revisions of 1986, 1993, 1999, 2005, 2010 the Commission  preferred  fixation  of  a  uniform  percentage  as  the  criteria  for fitment in the Revised Pay Scales as it will spread the advantage evenly for all employees. While recommending the new pay scales, the successive PRCs also took  into consideration the financial position of the State Government.


06.03.               Major   Associations   have  now  represented   for  percentage   of fitment on Basic pay ranging from 40% ‐ 60%. Some of the Associations have represented for service weightage as fitment for determining the pay scales.


06.04.             The Telangana Gazetted Officers Central Association in their representation  has stated that during the period from 1.7.2008  to 31.7.2013, the accumulated inflation had increased to 104.9% where as the Dearness Allowance sanctioned to State Government employee was just 63.344% and as such there was a loss of more 41.596%.   There was another loss of 27.504% in the calculation of Dearness Allowance as it was based on the basket of family living survey conducted in the year 1999‐2000 and since them the consumption basket had totally changed and thus the quantum of fitment of 69.10% was essential for the employees to have a comfortable living without financial hardship.


06.05.            The   A.P.   Non‐Gazettted   Officers   Association   in   their representation has sought for a fitment of 69% on Basic pay on the basis of difference in the rate of inflation between 2012‐13 and 2013‐14,   using the following formula.

i)             D.A.as on 1.1.2013  = 54.784%

ii)           Fitment required = Difference in inflation X D.A on 1.1.2013

Average inflation in 2012‐13

1.305   X 54.784 = 68.54 or 69%

10.43


06.06.              The Progressive Recognized Teachers Union, AP(PRTU) in their memorandum has requested for a fitment of 60% on  Basic pay by calculating a rise of 58% in the consumer price index from July, 2008 to February, 2013.


06.07.            The  Government   Junior  Lecturers  Association   in  their representation has requested for a fitment of 69% on Basic pay by calculating a) a loss of 25% to the employees due to a difference between the accumulated inflation and the Dearness Allowance sanctioned and b) a change in the consumption   basket   of  employees   requiring   addition   of  another   43%   in Dearness Allowance to fully nullify the existing inflation.


06.08.               It is evident  from the representation  of employees  associations that in deciding the percentage of fitment two important factors have to kept in mind viz a) increase in the prices of consumer items and b) change in the consumption pattern and addition of new items of expenditure.  While working out  the  Minimum  Pay,  the  Commission  has  taken  both  these  factors  into account.  The price of food and clothing are taken on the basis of market rates prevailing as on 1.7.2013.   Additional expenditure of 10% of total expenditure on food and clothing and other miscellaneous items is now incorporated in the Minimum  Pay  to  also  provide  for  new  items  of  expenditure  and  changing pattern of consumption.   Minimum Pay now fixed is, in our view, a realistic assessment of the money that will be required by an employee of initial cadre to maintain himself and his family in reasonable comfort and with due dignity.


06.09.               Keeping in view the raise in the quantum  of minimum  pay, the Commission recommends a fitment of 29% on Basic Pay.   The Commission  further  recommends  that  the  fitment  in  the  revised  scale may be made in the following manner:

(1)  D.A.   admissible    as   on   01/07/2013    i.e.,   63.344%    may   be added to the Basic pay.

(2)  29% of the basic pay may be added to the total of Basic pay + D.A. arrived at (1) above;


STU AP


(3) The pay of the employees should be fixed in the relevant revised scale at the stage next above the amount arrived at as at (2) above;

(4) If an employee’s pay when fixed as above falls short of the minimum in the revised pay scale, it shall be fixed at the minimum of the scale;

(5)  If the amount so fixed exceeds the maximum, the excess shall be  treated  as  personal  pay  and  it  should  be  absorbed  in future pay increases or in the stagnation increments sanctioned.


06.10.               The  Commission  recommends  that  the  revised  pay  scales should come into force from 1.7.2013.   As regards giving monetary benefit we deem it appropriate to leave the date from which it would come into effect to the Government keeping in view its resource position and the demands on those resources.